Nowadays, a slowdown of any kind on a website can generate losses both in terms of SEO and in terms of turnover.

Research has also shown that 88% of Internet users no longer return to a site when they consider it too slow. This statistic reflects the current requirements of Internet users in terms of the experience they are looking for on a website.
Indeed, they not only want sites that offer quality content, but also, and above all, they want these sites to load faster.
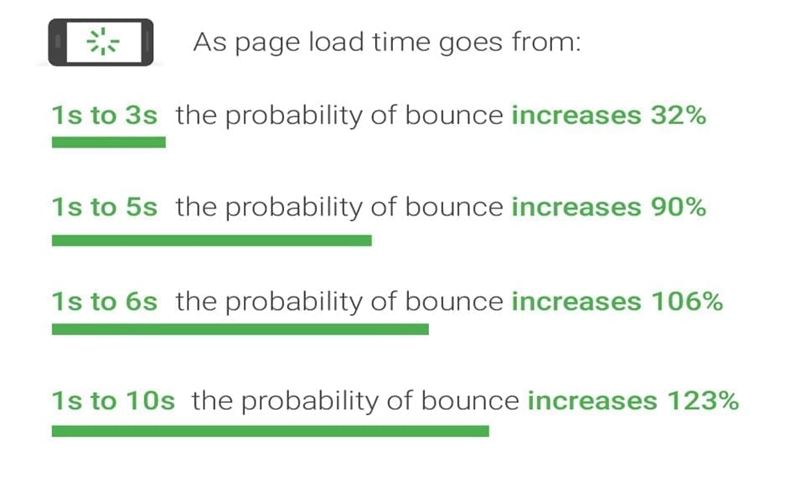
Source : Google
Therefore, to hope to attract visitors, convert prospects and even have a good place in the search results, it is imperative that you are interested in the loading time of your website.
For this, you do not have to worry since there are already tools that provide owners with information about the loading time of their website.
These tools also offer them actions to take to remedy the slowness observed.
This is the case for example of Gtmetrix, a tool that I invite you to discover throughout this article.
But before you dive into the world of this tool, I’ll show you the different reasons why having a fast site is essential.
Chapter 1: How important is your site’s loading speed to your digital strategy?
This first chapter will allow me to first explain the reasons why it is important to be interested in the speed of your website. Then, I show the causes that could justify the slow loading of a website.
1.1. The positive effects of the speed of a website on your digital strategy
Among the effects that the loading speed of your web page can have on your digital strategy, you can retain:
1.1.1. The impact of speed on web referencing
As a factor for measuring user experience, loading speed has been established since 2009 as a very important element in the display of websites in Google results.
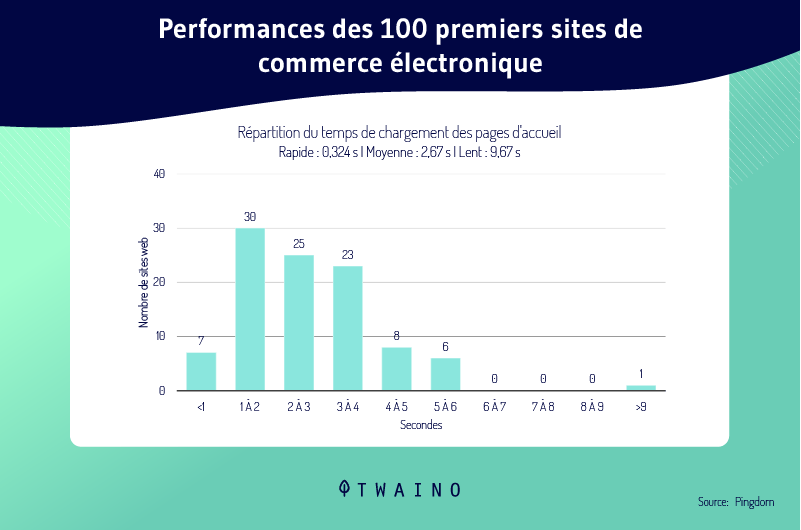
Indeed, since users will spend more time on websites that load quickly, Google has made speed a criterion for ranking and relevance. Thus, websites that load faster are more likely to rank higher in search results.
1.1.2. The impact of site speed on social media advertising.
Like paid ads on platforms like Google and Facebook, most social platforms prioritize the distribution of paid content based on sites that have fast loading speeds.
Indeed, social networks ensure to provide Internet users with quality content. Thus, they favor certain criteria, including loading speed, to display the content of their news feed.
Facebook, for example, had an algorithm change that prioritizes user experience and loading speed.
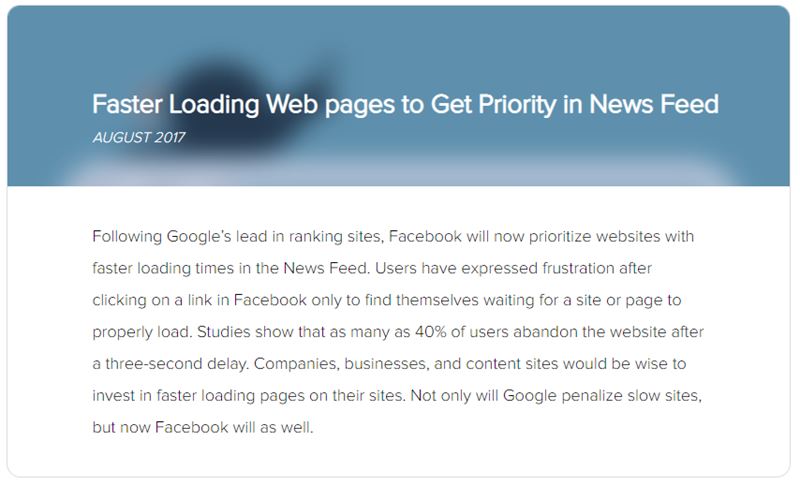
So, while many factors come into play for Facebook’s algorithm with social ads, fast load time influences how posts and ads appear in News Feed, while slow load time produces l ‘opposite effect.
1.1.3. The impact of site speed on user experience
Loading speed is one of the reasons why we see a high bounce rate on certain sites. The bounce rate refers to the number of people who leave your website after visiting only one page.
If a site has a slow load time, people won’t stay longer and leave without even looking to see if the page might appeal to them or if they were going to find the information they need.
This finding supports the idea that slow sites have a very high bounce rate, while faster sites tend to have a lower bounce rate.

Source : Backlinko
Moreover, the relationship between the bounce rate and the number of people who left a site after visiting only the first page, allows you to understand that the bounce rate is what makes it possible to measure the quality of the site. user experience at a site level.
However, keep in mind that the bounce rate is also part of the criteria for referencing a web page.
Thus, more bounces mean poor positioning in Google results, while a low rate would imply a good position.
1.1.4. The impact of the loading speed of a site on the conversion
rate The conversion rate on a website is determined by the ratio between the number of visitors and the number of people who have carried out an action. If we refer to the sale, it is the number of the percentage of people who made a purchase.
The loading time of a web page also influences this figure since it represents an important element in determining the bounce rate. If people are bouncing due to slow load times, they won’t convert.
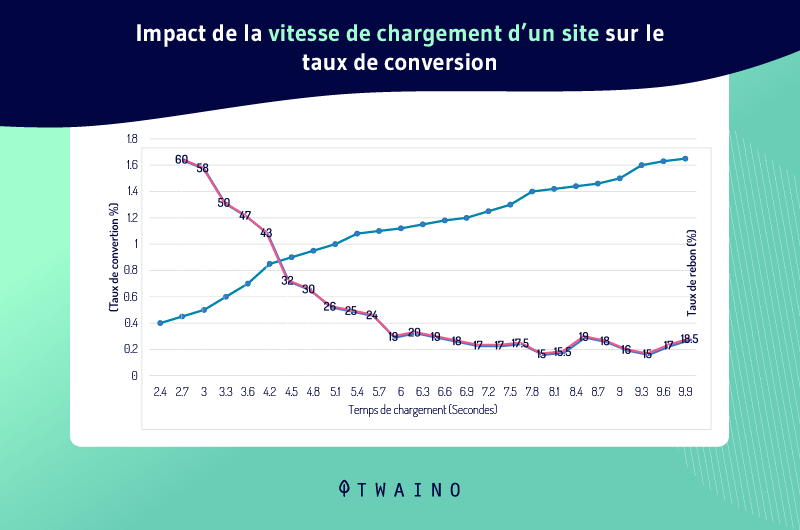
This is especially true if your website has a longer checkout or conversion process. Likewise, if your site is fast, people will quickly find the information they are looking for.
Although this list is not completely exhaustive, I will show you the different reasons that justify the slow loading of a website.
1.2. Some causes that can justify the slowness of a website
The cause of the slowness of your website can come from:
1.2.1. The existence of several flash contents on the site
Flash or Adobe Flash is a web development environment intended for the creation of multimedia and interactive contents for the Internet.
It has been launched since 1996 and allows to add interactive or multimedia content to a site. These contents are executed using a player (flash player) integrated into the browsers or web server.

Flash, although a good way to add content to a website, can be one of the reasons why the latter is slow.
Indeed, flash content is usually voluminous. However, as you know, more volume corresponds to more HTTP requests and therefore would justify a high loading time.
1.2.2. Poor coding of the various pages of the site
The reasons for the slowness of a website can also be due to coding. Whether it is the codes of your style sheet or the JAVA files, it is possible that when creating your website, certain unnecessary elements are added to it and make these files bulky.
These include, for example:
- Frequent spaces;
- Unnecessary comment lines;
- And many others.
1.2.3. Displaying a large number of advertisements
The advertisements you display on web pages are a good way to monetize a website.
However, they should not be favored at the expense of a good user experience. Because they slow down the site by causing several HTML requests.

Source : Knowonlineadvertising
The recommended solution therefore does not consist in no longer using them, but rather in using them only when the need really arises.
1.2.4. Failures of the hosting service
The slow loading of your website may be due to the low capacity of the host used.
Also, if the server you host your site on is slow, chances are the site will be even slower.

This slowness can also occur when you are on a free, poor quality host or when the configuration of your site requires a more efficient hosting service.
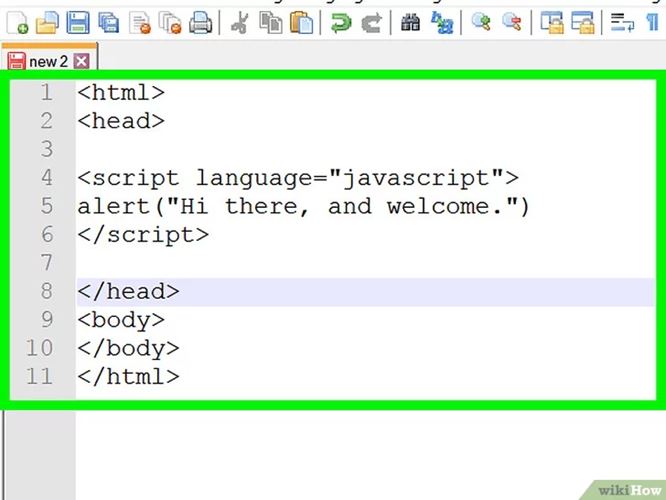
1.2.5. Badly written or badly positioned scripts
When you put a Java script in your HTML page, it is possible that when the page loads, the client browser first intercepts the Java code.
It will then stop loading all the other elements while it finishes parsing, interpreting and executing the Java script.
Source : Wikihow
Similarly, poorly written code can conflict with other elements of your site, resulting in excessive loading times.
1.2.6. The absence of a caching
First, the cache designates a temporary memory. Its role is to keep information from a source for a while when you access it for the first time.
Thus, during a second or subsequent access, the loading time of information from the same source is faster than the first time.
This allows you to see that the existence of a cache allows your server to save a version of the pages that users consult on your website. This saved copy will be loaded, thus promoting the rapid loading of the pages of your site.
On the other hand, the absence of a cache will force the server to resume loading from zero. Which would probably take more time.
1.2.7. The overload of the database at the level of your website
The database at the level of your site has the role of recording and classifying all the information concerning the site. Thus, the older it is, the more likely it is to have accumulated useless information that can slow it down.
This information may concern: Log files, plugin information, theme files and any other element that may cause the database to be overloaded, resulting in long loading times.
1.2.8. Bad optimization of JavaScript
Beyond these many features, the Java language is what allows your site to be pleasant to browse.
However, if not optimized, it can cause website latency issues. We can meet for example: “A Java blocking the loading of the page”.

Source : Interworks
Indeed, when your web pages try to load, and they encounter a java code, the loading of the page in HTML is stopped, thus allowing all the java files to be loaded.
1.2.9. Not Using a CDN
Network Content Deliver Networks (CDNs) are decentralized servers that allow you to load elements of your site from a more appropriate server.
Moreover, due to their distribution in various places of the globe, they offer a certain proximity which allows users to benefit from a quick access to your site.

The non-existence of a CDN network for your site assumes that the elements of your site and all loading requests are made from a single server.
This is the cause of the overload of your server which will then take longer to respond.
International users will also have a lot of difficulty before logging into the site.
1.2.10. Using multiple plugins
Plugins allow you to add various features to a website. Given their number and the thousands of features they allow you to add to websites, it is certain that we are looking to install a multitude of them.
However, far from increasing the performance of your web page, plugins contribute to an increase in the loading time of the website due to the work it requires from the server.
Sometimes this problem can be due to the fact that the plugins do not match the configuration of the sites on which they are installed.
1.2.11. An overloaded home
page The home page is the showcase of your site, so it is recommended to make a good impression there to interest Internet users. But, this recommendation should not be used as a reason for you to overload it with graphics, images or videos.
If you do, you may be missing out on your goal of engaging visitors.
Indeed, when you overload your page, you increase its size, which would be the source of high HTTP requests and therefore of a loading that does not comply with the wishes of Internet users.
Now that you know the different causes of a slow website, let’s discover the GTMETRIX tool.
Chapter 2: Gtmetrix, a tool to boost the performance of your website
In this chapter, I present the Gtmetrix tool in detail. You will discover these features and the reasons why I recommend it to you.
2.1. Gtmetrix: What is it?
Gtmetrix is a software that allows you to analyze the performance related to the loading speed of your website.

Concretely, this tool provides detailed analyzes on the loading speed of a web page and offers their owners avenues for improvement.
It was developed by the company Carbone60 : A Canadian company specializing in the cloud and headquartered in Toronto.
Gtmetrix has been online since 2009, and has over 350,000 users. It has already been used to analyze more than 350 million web pages.

The objective pursued by Gtmetrix is to provide a detailed analysis of the web pages submitted to it.
As a result, it produces a set of reports that inform about the causes of slowness of a website.
In short, Gtmetrix analyzes your site and provides:
- Pagespeed and Yslow scores;
- Page load times.
The tool is offered in two versions.
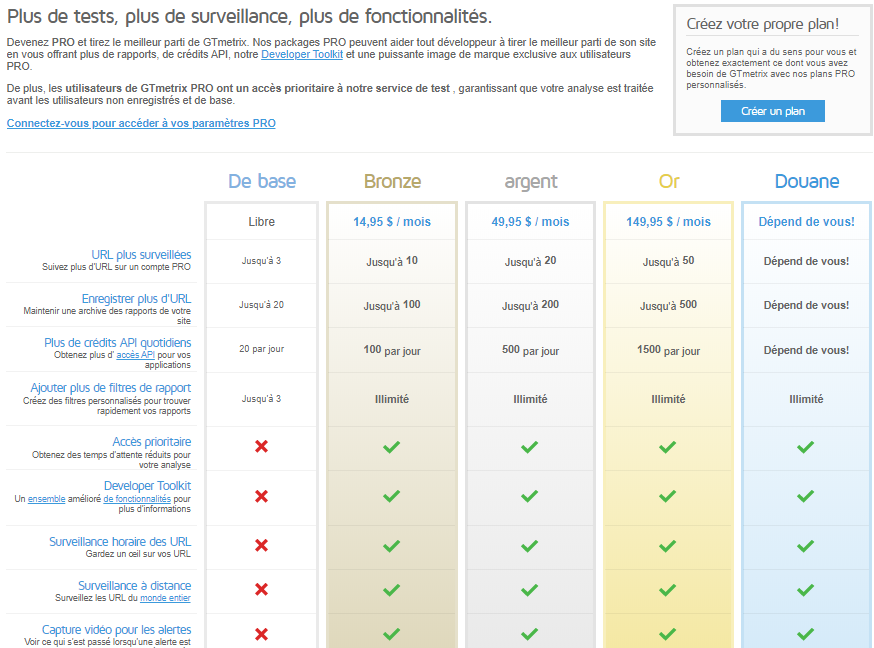
A free version which gives you access to basic services and a pro version which allows you to access other services by paying a monthly subscription.
The free or basic version allows you to:
- Monitor the performance of 3 web pages;
- Save up to 20 scanned site report archives;
- Obtain up to 20 API accesses per day;
- Create up to 3 custom analysis filters.
The pro version allows you to have access not only to the advantages of the basic version, but also to access other features.
You have plans such as:
The Bronze plan : This plan costs $14.95 per month and allows you to have access to functions such as:
- Monitoring of 10 URLs;
- Storage of 100 reports;
- Unlimited report filters;
- To see the loading time of your analyzes reduced;
- Hourly, remote monitoring and video creation.
The Silver plan which costs $49.95 per month and allows you to:
- Monitor up to 20 URLs;
- Save 200 analysis reports;
- 500 credits for API access;
- Unlimited report filters;
- To see the loading time of your analyzes reduced;
- Hourly and remote monitoring, creation of alert videos.
- Downloading PDF reports featuring your logos
The GOLD plan : The gold plan worth $149.95 per month. By choosing this plan, you will have access to:
- 50 monitored URLs.
- 500 recorded analysis reports
- 1500 API credits
- Unlimited report filters Reduced
- loading times for your analyses,
- Hourly and remote monitoring, creation of alert videos.
The customs plan: This is a free plan which gives you the possibility of choosing the elements of your subscription. In this case, the rate is determined on the basis of the services you put into it.
Each of the pro plans entitles you to the Develop Toolkit.
2.2. The different features or options of Gtmetrix
Regarding the options of Gtmetrix, they are to be classified into two categories.
The first concerns simple options.
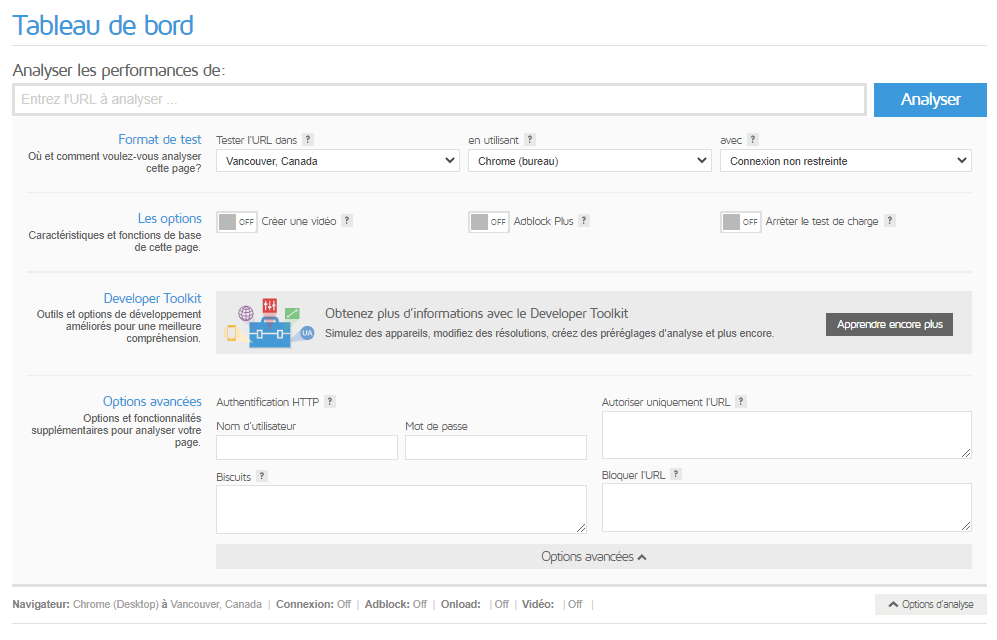
These are:
- The Test Region option : This option allows you to analyze your site from several locations or locations:
- Dallas (USA);
- Hong Kong (China);
- London (England);
- Mumbai (India);
- Sydney (Australia);
- Sao Paulo (Brazil)
- and Vancouver (Canada).
- The Browser option : With this option, you have the possibility to select the browser from which you would like to carry out your analysis;
- The connection option : The connection option allows you to see how a type of connection can affect your web page;
- The AdBlock Plus option : This option allows you to prevent the loading of advertisements during the analysis of your page;
- The video option : This is a feature that visually shows you the loading behavior of your page.
The second category includes advanced options. These options concern:
- HTTPS identification : which allows you to connect the site that requires HTTPS identifiers;
- Authorization of a URL : This option allows you to only authorize the loading of resources corresponding to a list of URL addresses (to be defined).
- Blocking of a URL: which blocks the loading of a URL address selection (to be defined);
- The Cookies option: which allows you to analyze a page that requires the sending of a cookie to connect.
Beyond all these elements, the tool offers you to compare URLs, to set up URL monitoring with the possibility of receiving reports by email.
Likewise, if you use a pro account, Gtmetrix gives you access to more enhanced features.
For example, you can choose the display resolution of the results to see the behavior of your page on several types of media: This is the Develop Toolkit.
Another feature of this tool concerns alerts. They allow you to receive a notification as soon as the page you are monitoring exceeds a value that you have set. You also have the possibility to download the analysis report of your site in PDF.
Once on the Gtmetrix site, the first thing I recommend is to start by registering.
Registration is easy since you just need to enter your first and last name, an email address and a password. Once this is done, you validate your account and you start enjoying the benefits of the basic plan.
2.3. Why use Gtmetrix?
Among the reasons that could justify the use of Gtmetrix, you have:
2.3.1. The impact of the loading speed of a web page
In addition to the reasons mentioned in chapter 1, a search on the dareboost me to see that the loading speed of a web page had an impact on the results of the site at various levels. For example, at the level:
Commercial: When the loading time of your page exceeds a certain time, the conversion rate can decrease by up to 7%.
Additionally, 67% of online shoppers said a site’s load rate was a reason for cart abandonment.
User experience: Regarding the user experience, dareboost tells you that 60% of Internet users leave a site for its competitor when the loading time is greater than 5 seconds.
SEO: From a SEO point of view, Google penalizes since 2010, 1% of sites that have too long a loading time.
In view of all these statistics, we can say that the loading speed of a page is very important whether it is to attract visitors or sell products.
It therefore seems obvious that when you hope to have results with your site, a speed performance analysis is necessary. This analysis will allow you to:
- Know its loading speed;
- Identify bottlenecks;
- Brainstorm ideas for improving speed.
This is exactly what you get with the Gtmetrix tool! The second reason to use Gtmetrix concerns:
2.3.2. The characteristics of the tool itself
A quick visit to the Gtmetrix site allows you to see that it is an intuitive platform that integrates perfectly with your browser.
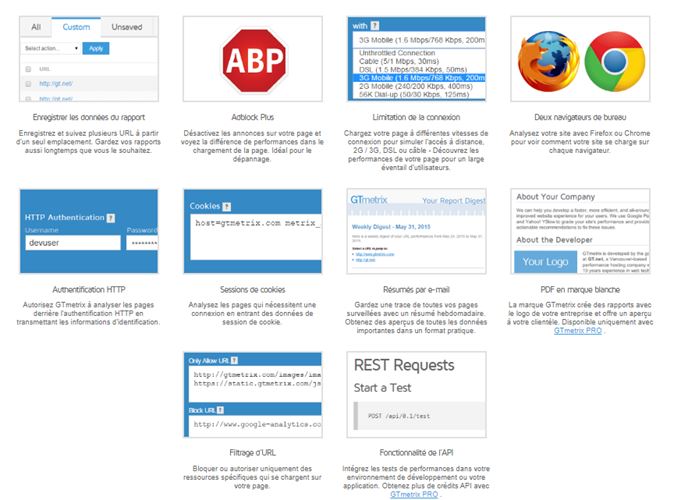
It is designed to be used by anyone and is based on a simple design.
Moreover, with Gtmetrix, you can access the analysis tool and do your analysis even if you have not yet created an account. Which seems very practical to get an idea of the tool and its different possibilities.
Gtmetrix is also recommended by the Codeinwp as the tool best suited to make a detailed analysis of the performance of a site.
Unlike some tools, Gtmetrix gives a multitude of analysis options concerning the configuration:
- Browsers;
- Location;
- The type of connection;
- And devices to use to stimulate analysis.
The third reason to use Gtmetrix is:
2.3.3. The availability of documentation
Since Gtmetrix is a tool accessible to everyone, it provides different guides for optimal use by anyone.

Indeed, as soon as you register, you have access to a welcome message in which Gtmetrix offers to guide you throughout the analysis of your website.

Among other things, you will discover in these guides:
- The process for analyzing your web page;
- The elements to understand your reports;
- How to configure and monitor your various URLs;
- Etc.
Chapter 3: What are the different uses of Gtmetrix?
In this chapter, I show you the different ways to use Gtmetrix.
3.1. Perform speed tests
3.1.1. Perform a simple analysis
To perform an analysis on the loading speed of your site with Gtmetrix in the simplest way, you just have to: Go
- site Gtmetrix then log in or create an account (the creation of accounts is easy and it allows you to have direct access to the basic functions).

- Fill in the URL of the page: A simple copy-paste is enough.
- Finally, click on analyze and wait for the analyzes to appear.
3.1.2. Do an analysis by setting the Gtmetrix options
Once you sign up, you will find that Gtmetrix does not limit you to just copying and pasting and pressing an address. You also have the possibility to do tests by modifying several elements.
In reality, all you have to do is press “Analysis options” and choose the parameters for your tests.
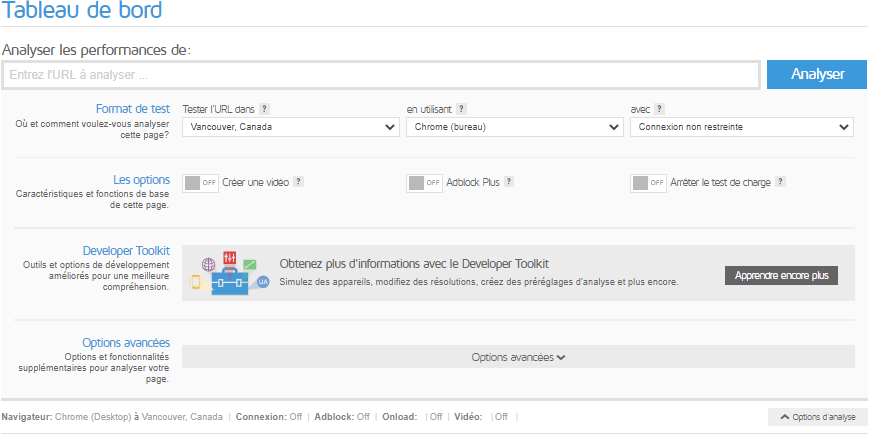
With the location parameter, you choose the location of your test. This is a very important option in analyzing the performance of your website, as it relates to the location of your servers.
With this parameter, you can effectively understand the connection problems and the speed of your site from several places on earth and thus see the loading difficulties that your potential users could encounter.
Apart from the location, you can choose to perform your test using the browser: Google Chrome or Firefox.
3.1.3. Perform an analysis from the advanced options of Gtmetrix
Apart from the simple analysis and the analysis by choice of parameters, Gtmetrix offers you an advanced analysis which allows you, for example, to analyze the versions of a site being created.

You can also, thanks to the advanced options, quickly analyze sites protected by HTTPS. Finally, the tool gives you the possibility to access pages that require the use of cookies.
3.2. Compare URLs
To compare URLs, simply perform a first scan or choose from pages you have already saved.

Then click on “Compare” which appears in the menu on the right of the screen. Once you click on this menu, a new window appears.
Then enter the URL address of the page with which you want to make a comparison. And press compare.
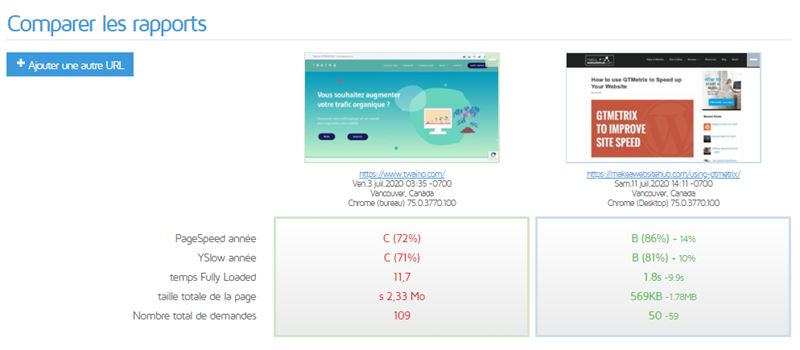
Wait for the new window to load, which will only take a short time to appear, there you will find the two reports side by side.
Such an arrangement allows you to clearly see the analysis elements of the first URL as well as those of the second URL.
You can then study them at your leisure and determine the most optimized site.
3.3. Monitor one or more URLs
In the basic option, you have the possibility to monitor up to 3 URLs.
When you want to configure monitoring for your URL address, just click on “Monitor”.

Once you press Monitor, you can see in the new window that pops up, a drop-down list. Choose from this list the monitoring that suits you.
This can be daily, weekly or monthly monitoring. If you have a pro account, these three forms of monitoring are supplemented by hourly monitoring.
You can schedule multiple URLs to be monitored at regular intervals (daily, weekly, or monthly).
3.4. Create alerts
Gtmetrix offers you in this part to create conditions which, when they are reached or exceeded, will trigger an alert which will be notified to you by email.
To do this, you must first choose the option to create alerts that you will find in the menu that appears to your right on the screen or at the top if you are using a mobile.
Once chosen, check “Enable email alert” and create the different conditions for which you would like to receive a notification.
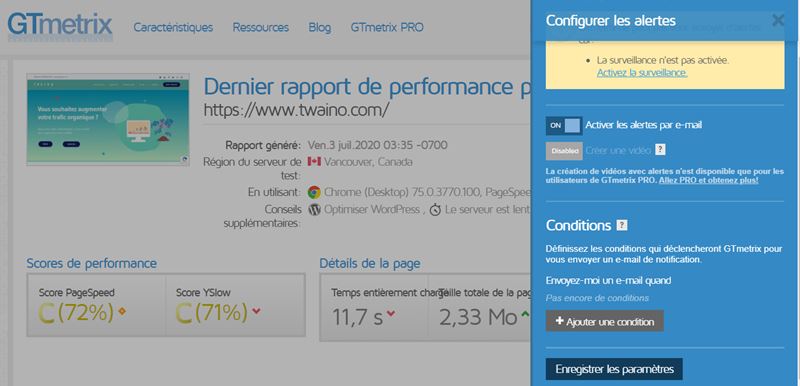
Click on add a condition which is then at the bottom and choose the nature of your condition. These can be performance scores, load time or page size.
Once chosen, define in the second box if the alert is sent when the chosen element is lower or higher than a value that you must enter in the last box. Finally press save.
3.5. Create an API
The API (Application Programming Interface) is a program that allows the functionalities of one application to be used by another.
The GTmetrix reset API offers you an integration of performance tests on your different development platforms or on an application. But before using it, you need an API key.
This key or password establishes the connection between the two applications to give you access to the use of data from another application.
To generate the details of this API, you just have to go to the bottom of the page and choose Gtmetrix REST API:

Click on it and you will have the details on how to obtain the identification elements of your API, namely the key and email address.
To get the full details of the Gtmetrix API, you should first go to: https://gtmetrix.com/api/0.1/
Once you access this address, you will need to login to the using your GTMETRIX email address and password.
Then you can generate API keys just by clicking in the API Key box.
To make analysis requests, you need API credits. API credits are paid to you daily and according to your plan.
One credit corresponds to a request while 5 corresponds to a video request.
Chapter 4: How to interpret a Gtmetrix analysis?
Here, I present to you the elements of an analysis of Gtmetrix.
4.1. What are the different elements of a Gtmetrix analysis?
When you perform your analysis on Gtmetrix, whether it is a simple, custom or advanced analysis, you will get in the new window that appears several elements.
First, you have the icon of a preview of your site which is followed by the name of the report:
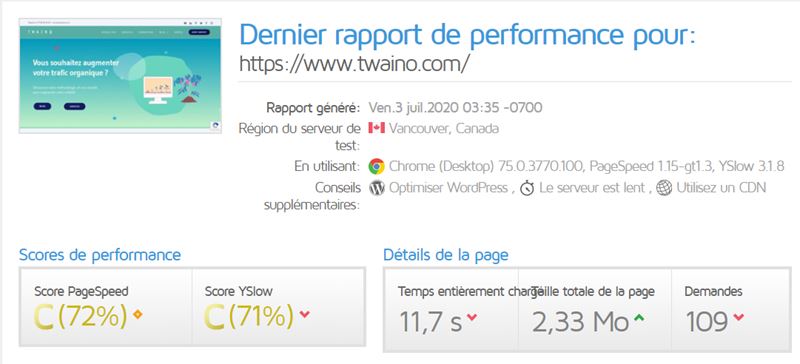
You can read on the screen information such as:
- The analyzed URL;
- The locality or geographical position of the test;
- The date and time the report was generated;
- The browser used to do the test;
- The type of site you use;
- A message telling you if your site is slow or not.
At the bottom of this first information, you have your PageSpeed and Yslow scores as well as the details on your page. These details include:
- The loading time;
- The size of the page;
- The resources loaded or requested from the server to display the page.
To the right of the screen you have a menu that gives you access to other actions you can perform that we talked about in chapter 2.
Once you scroll down you can see a table with details. 6 columns. These are the results of your analysis.
It includes:
4.1.1. The PageSpeed analysis
The PageSpeed analysis is based on the Google PageSpeed Insights.
The first two elements of the table inform you about the PageSpeed and Yslow tests:

The details of the analysis of this tool are recorded in a table in 4 columns:
- The first column contains a list of good practices : Recommendations are listed best practices you should do to make your site faster. When you tap on a recommendation, the list of actions to take is displayed.
- The second column is called CLASS, it displays the percentage of completion of a recommendation on your website.
- Column 3 informs you about the nature of the files to be corrected (CSS, JavaScript, server file, images, etc.).
- Finally, the last column tells you about the priority of a task. The priorities can for example be high (minimize redirects), Medium (prefer asynchronous resources) or low (avoid a charset in the META tag). The score assigned is between 1 and 100.
Good practices for pagespeed analysis are:
- Defer JavaScript analysis;
- Minimize redirects;
- Take advantage of browser caching;
- Minimize Java;
- Minimize CSS;
- Specify a cache validator;
- Optimize images;
- Enable compression;
- Avoid bad requests;
- Avoid redirects on the landing page;
- Enable Keep-alive;
- Small inline CSS;
- Integrate JavaScript for small sites;
- Reduce the size of the request;
- Put CSS in the header of the page;
- Serve resources from a consistent URL;
- Serve scaled images;
- Combine images using Sprite CSS;
- Avoid CSS @import;
- Prefer asynchronous resources;
- Specify a character set at the start;
- Specify the dimensions of the image;
- Avoid a character set in the meta tag.
4.1.2. Yslow
Yslow analysis is also provided in the same format as pagespeed. That is to say a scoring system between 1 and 100. You have a display of practices in different colors to inform you of the task at hand.
Thus, the color:
- Green indicates the parts already optimized on your site;
- Red represents the parts you need to optimize;
- Orange displays the parts whose optimization is not yet complete.
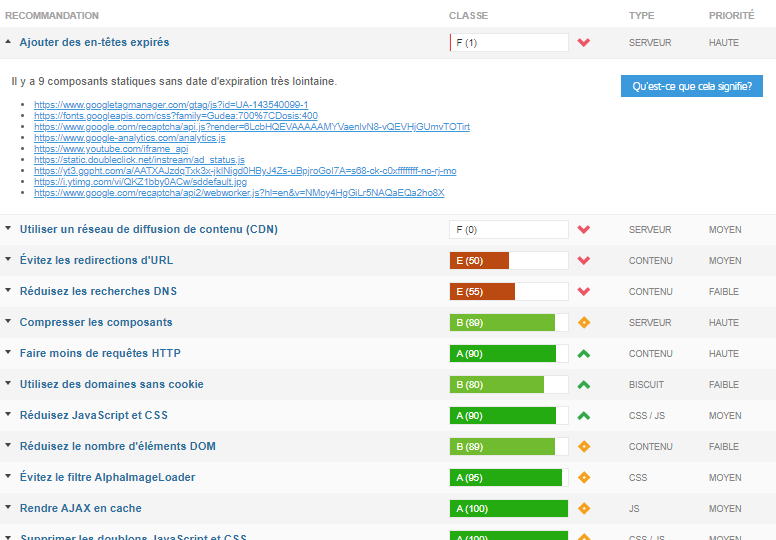
The list of YSlow recommendations are:
- Add expired headers;
- Use a CDN broadcast network;
- Avoid URL redirects;
- Reduce DNS lookups;
- Compress the components;
- Make fewer HTTP requests;
- Use domains without cookies;
- Minimize JavaScript and CSS;
- Reduce the number of DOM elements;
- Avoid the Alphaimageloader filter;
- Cache Ajax;
- Remove duplicate JavaScript and CSS;
- Avoid the HTTP 404 not found error;
- Use Get for Ajax requests;
- Avoid CSS expressions;
- Reduce the size of cookies;
- Reduce the size of the favicon and cache it;
- Configure E-tag entity tags;
- Make JavaScript and CSS external.
However, it is worth remembering that the two parameters, although relating to the same query, are distinguished by the fact that they analyze according to different criteria.
This undoubtedly justifies the difference in rating for the two tools.
4.1.3. Cascade charts
The cascade tool is the tool that allows you to know precisely:
- The elements loaded on your page;
- Loading order and loading time.
Thus, thanks to this tool you could see in a concrete way the elements that slow down the loading of your web page.

Note that the information provided by Gtmetrix can be downloaded in PDF format.
At the level of the cascade tool you have 4 columns:
- The column URLname of the file or the resource which is analyzed. When you hover your mouse over one of the files, you can see the file’s full path and extension;
- The second column relates to the status of the analysis. With the information displayed, we can know if the analysis of this file was successful or not;
- The third column which corresponds to the size tells you the weight of the file. As you can imagine, the smaller this size, the faster your site;
- The last column of the waterfall charts gives you information about the chronological loading of your file.
The part comprising the chronological loading allows you to display the movie of the loading of the different elements of your web page.
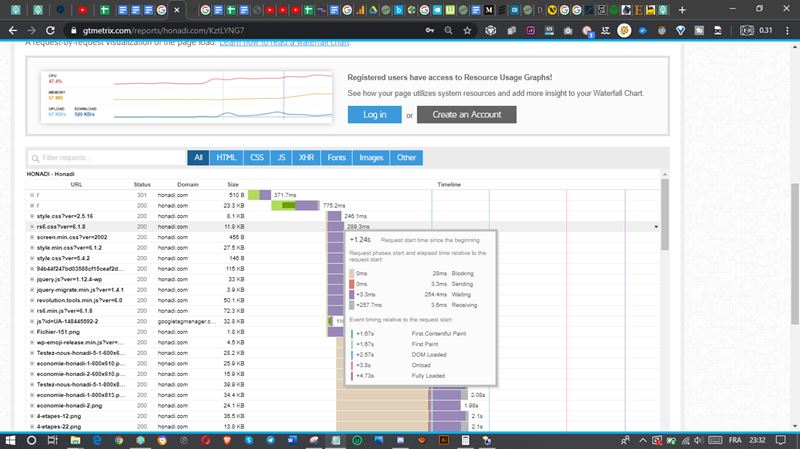
Indeed, when you point your cursor on the bands that are at the level of this column, you can see:
- The loading order of the elements of your web page;
- The details of a request as well as its execution time;
- You will also see the time taken to send, download and complete a request.
Likewise, when you get even closer to the items in the timeline loading column, you can see colored bars there.
Of course, each color has a meaning.
Indeed, the color:
- Maron : It informs you about the waiting time of a request before it is sent to the server.
- color Turquoise indicates DNS lookup time.
- The green represents the time to establish the connection between the host (server) and the client (browser).
- The color Red indicates the time of sending and downloading a request
- The color Violet, this color allows you to see the duration during which the server waited before answering you.
- color Gray : The gray color corresponds to the reception. In other words, it is the time during which the browser downloaded the response from the server.
Beyond these different colors, the cascade file also shows you 4 lines representing the calendar of events.
These lines include:
- The green line which represents the display of the first rendering of your website.
- The blue line that represents the DOM loading time.
- The red line that indicates when all parsed page elements have been downloaded and executed by the browser.
- The purple line means that the page is completely downloaded it tells you the time of inactivity of the network.
4.1.4. The loading times of your page
The timing shows you the loading times of the pages. From orientation to complete display, including connection times and the time emitted by the server to respond.
You also see in this part the loading time of the first information on your website, the time of the first rendering, etc.

The timings show you:
- The response time of your server;
- The loading time of the first information. On your site and (first byte);
- The redirection time : the time between the passage and the loading of the URL from another;
- The overall loading time: the time for loading all the resources of your page;
- Your Page Speed Index : This is a metric that shows you how fast the page fills. The lower this index, the better your index;
- Interactive Doms (the time it takes to display and analyze HTML data);
- First Paint : Marks the actual loading time of content on the page. It gives you an idea of the experience of Internet users who visit your page.
4.1.5. Creating a video showing the loading of your web page
The video tool that allows users to make a video recording of the pages loading in order to effectively identify loading problems.

Indeed, the video allows you to visualize image by image how to load your page so that you can see in a concrete way the bottlenecks of the connection of your site.
4.1.6. The History
The History tool shows you the graph in relation to the loading time of the timing elements of a page over several days.
With the history, you will see:
The graph on the synchronization of the pages of your site;
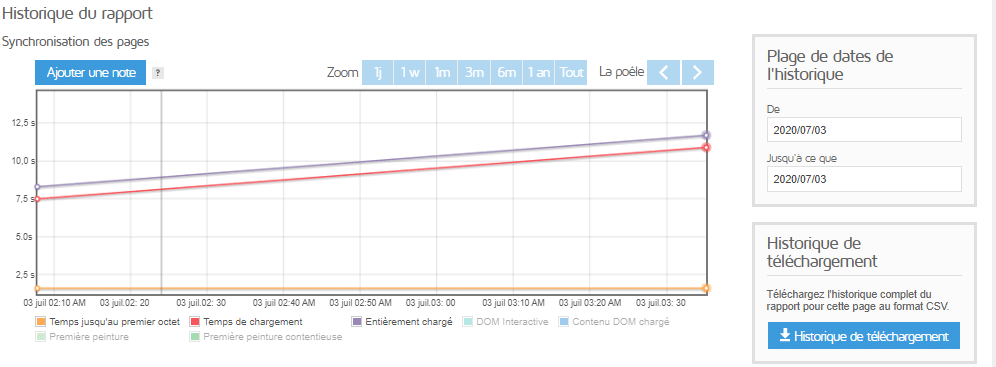
This graph shows you the evolution of the loading times of the different elements of your page in seconds and days. You can see:
The graph on the page size and the number of requests of the HTTP requests at the level of your page;

This graph gives you an overview of the size of your page and the number of requests recorded during a given period.
You will discover in particular
- The size of loaded HTML data represented in red;
- The total page size for each day represented by the color blue;
- The evolution of the number of requests represented by the color green.
The Pagespeed and Yslow score graph is the last element of the history tab:

In this graph, you will find details about the Pagespeed and Yslow scores of your web page on different days.
The pagespeed data is represented in yellow while the curve showing the evolution of Yslow scores is represented in blue.
The History tool allows you, among other things, to add notes at the level of each graph. You also have the option of setting a start and end date for the history display.
Note also that if you have a pro plan you could define and see all these graphs over 1 day, a week, several months and even a year.
The history provided by Gtmetrix analysis can be downloaded in CSV format.
Now that you have seen the different parts of Gtmetrix analysis, learn how to do the
4.2 waterfall chart reading. How to interpret the cascading results?
The waterfall tool is the element that will enlighten you on the performance of your website.
Among other things, it provides information that will allow you to recognize problems and diagnose/resolve performance issues on your site.
When it comes to waterfall charts, it’s important that you know first that the bands are scaled. That is to say that the length of the strips is distributed according to the total loading time of the page.
The absence of this information could skew your analysis and make you believe that you have a problem, when you don’t.
To read these results, you should always look at the fully loaded time and the actual demand duration, to ensure that you are reading the chart in the correct context.
Most reported issues with pagespeed and yslow can be found at the header level. To display the header of a file, just go to the cascade tab and click on an element.
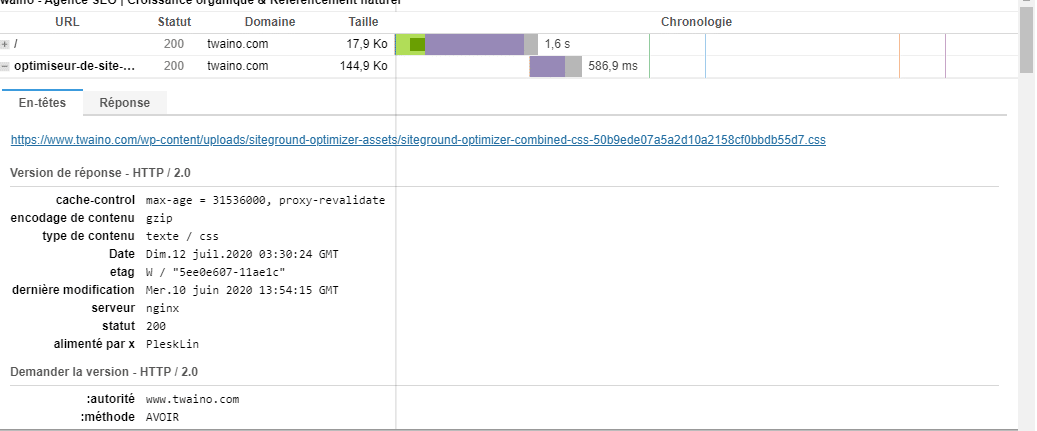
When you see the filenames in red, it means an error occurred while trying to load the application. So the browser that cannot retrieve this request just ignores it.

Also, if you see long bars in your waterfall file, this may indicate the presence of too many HTTP requests and point to various problems.
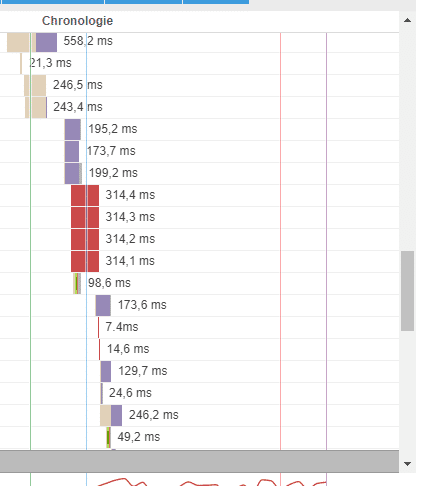
For example, when you find:
- A long gray bar, it means that there are large files on your site.
- A long purple bar will indicate that your server is taking a long time to respond, so you should look for the reasons for your slow site on that side.
- A long maroon bar means that the browser initiated its request, but it is blocked or pending.
- If the long bar is green, it means you are having network and server connection issues.
- However, if there are long blank spaces between requests, it means that there are scripts blocking the execution of certain resources.
There you go, you now know how to read the performance of your website, you will now see how to use the recommendations given by Gtmetrix.
Chapter 5: Some best practices recommended by Gtmetrix to optimize your website
In this chapter, I provide you with a list of best practices generally recommended by Gtmetrix and which have the power to reduce the loading times of your website.
Indeed, Gtmetrix presents the elements of problems and instructions to improve the performance of websites after any analysis:
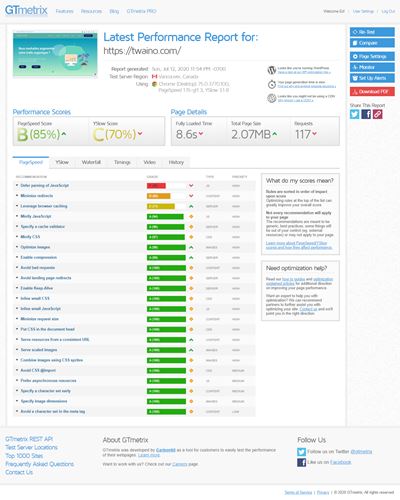
Let’s take a closer look at what these recommendations and other tips for optimizing your website mean.
Note that for a better understanding, some screenshots of some parts translated into French.
5.1. Some good practices for optimizing your website
5.1.1. Minify the CSS and minify the Java script
These two recommendations are based on a code optimization technique. Minification, since that’s what it’s all about, is a technique that consists of reducing the size of a code to increase the loading time on the servers.
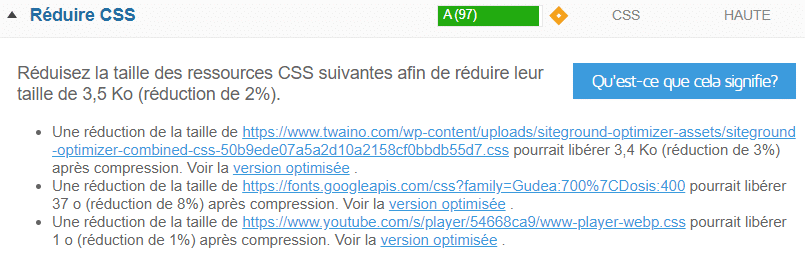
Concretely, it will be a question of removing unnecessary characters, margins, line breaks. And anything that can increase network traffic.

So to minify your JAVASCRIPT CSS files, you can either use a plugin or do it manually.
To do it manually, here is the procedure to follow:
- Save the file and download a copy from your server;
- Open the file from a code editor;
- Remove comments, spaces;
- Reduce class or variable names;
- Transform arrays into objects;
- Find answers to basic constant expressions;
- Optimize instructions;
- Save and upload to your sector.
This manipulation can be complex, I invite you to use the minification tools.
Among these you have:
- Minifier.org : This is a website that allows you to copy-paste your code and press minify to make your lightweight java or CSS files directly online

- Better WordPress minify : This is a WordPress built-in plugin that directly optimizes your Java and CSS files.

Here is a video that allows you to have more information on the subject:
&
5.1. 2. Optimize images
The larger the images, the more difficult it is for your website to load.

The image optimization process will therefore consist in reducing their sizes to achieve the balance between the smallest size which corresponds to a quality image. To perform this operation, one of the methods used is to compress the images before sending them to your site.
To help you, you can use the Tinybeest. This is a free extension that helps you quickly optimize your images.
Likewise, it is important to use a good image format for your site. The best current image formats are undoubtedly the files: PNG, JPEG and GIF. They have the advantage of being accepted by most browsers.
The other requirement is to choose a good compression quality versus size by finding a balance between compression ratios and file size.
5.1.3. Enable GZIP Compression GZIP
is both a file format and an application used to decompress and compress files.

Once activated, it reduces the size of your files.
To activate it, you can use:
- A plugin: To activate GZIP compression using a plugin, you can use the WP ROCKET which add automatic compression rules to your htaccess file. The Htaccess file is located at the root level of your site. This is a hidden file that you can access through an FTP manager.

- Modify the Htaccess file : Modifying the htaccess file to enable GZIP compression involves adding a line of code to the Htaccess file.
Here are the lines of code to add to the htaccess file:
# Compress HTML, CSS, JavaScript, Text, XML and fonts
AddOutputFilterByType DEFLATE application/javascript
AddOutputFilterByType DEFLATE application/rss+xml
AddOutputFilterByType DEFLATE application/vnd.ms-fontobject
AddOutputFilterByType DEFLATE application/x -font
AddOutputFilterByType DEFLATE application/x-font-opentype
AddOutputFilterByType DEFLATE application/x-font-otf
AddOutputFilterByType DEFLATE application/x-font-truetype
AddOutputFilterByType DEFLATE application/x-font-ttf
AddOutputFilterByType DEFLATE application/x-javascript
AddOutputFilterByType DEFLATE application/xhtml +xml
AddOutputFilterByType DEFLATE application/xml
AddOutputFilterByType DEFLATE font/opentype
AddOutputFilterByType DEFLATE font/otf
AddOutputFilterByType DEFLATE font/ttf
AddOutputFilterByType DEFLATE image/svg+xml
AddOutputFilterByType DEFLATE image/x-icon
AddOutputFilterByType DEFLATE text/css
AddOutputFilterByType DEFLATE text/
html erByType DEFLATE text/javascript
AddOutputFilterByType DEFLATE text/plain
AddOutputFilterByType DEFLATE text/xml
# Remove browser bugs (only needed for really old browsers)
BrowserMatch ^Mozilla/4 gzip-only-text/html
BrowserMatch ^Mozilla/4\.0[678] no-gzip
BrowserMatch \bMSIE !no-gzip !gzip-only-text/html
Header append Vary User-Agent

Where to find the htaccess file? The htaccess file is located at the root of your site. This is a hidden file, but it can be found through an FTP file manager like Filezia.
5.1.4. Minimize redirects
Redirection allows you to direct visitors who have entered the wrong URL, for example, to the correct URL address. They can be made permanently or temporarily.
Redirects also make your page accessible from multiple URLs.

However, it may happen that you make a mistake in setting up your URL address. In such a way that you write the URL address incorrectly, your page may take longer to load than usual.
This will cause a 404 error for example or give an unpleasant experience to visitors. Because of this, it is imperative that you be careful when setting up a redirect.

Better, it would be preferable to do it only if it is necessary. Here is a video to guide you:
5.1.5. Defer JavaScript parsing
When someone visits your website, their browser first displays your site in HTML. If while loading, the browser encounters elements in JavaScript, it will stop loading the HTML until it finishes parsing the data in java.
This process which can give a bad experience to visitors affects the loading time of your page. Thus, deferring JavaScript amounts to asking Internet browsers to wait for the HTML to load before downloading JAVA.

When a tool like Gtmetrix asks you to defer JavaScript, you can get in line with that recommendation by using the properties:
- ASYNC: Async downloads JavaScript while still parsing the HTML, but then interrupts the HTML parsing to run JavaScript.
- Or DEFER: The Defer attribute unlike Async downloads JavaScript while continuing to parse the HTML and waits to execute it until the HTML parsing is complete.
To use these properties on a WordPress site, you need to download the Async JavaScript extension.
It is a free WordPress extension. Once installed, just go to Settings → Async JavaScript to configure the extension. By choosing Async or Deferred.
How to do it concretely? Here is a video:
5.1.6. Avoid character sets in the META tag META
tags are very essential criteria in Google SEO. They make it possible to better identify the content of the web page.

It is also ready to describe a web page and add the keywords for which said page will be optimized.
This tag is placed at the top after the title tag. It is important that it reflects the content of your website.
If necessary, search engines may not take your site into account, thus causing a poor display of the page. Therefore, to optimize meta tags, you must avoid:
- Listing keywords in the META tag
- Use capital letters, numbers or special characters
See my SEO audit guide for more details on this element.
5.1.7. Serve scaled images
This recommendation occurs when you don’t use the actual sizes of the images to work on your website and you let CSS resize them.

A Scaled Image assumes that the image has been scaled to fit its intended use.
To do this, you can for example use imageket.io, an online tool that allows you to optimize your images. Simply connect your server to this platform to broadcast the images from a content delivery network. With URL-based editing capabilities, this platform will be able to resize and optimize your images.
You can also use a tool like Photoshop since editing an image is very easy.
With Adobe Photoshop, open an image:
- Open an image with Photoshop:
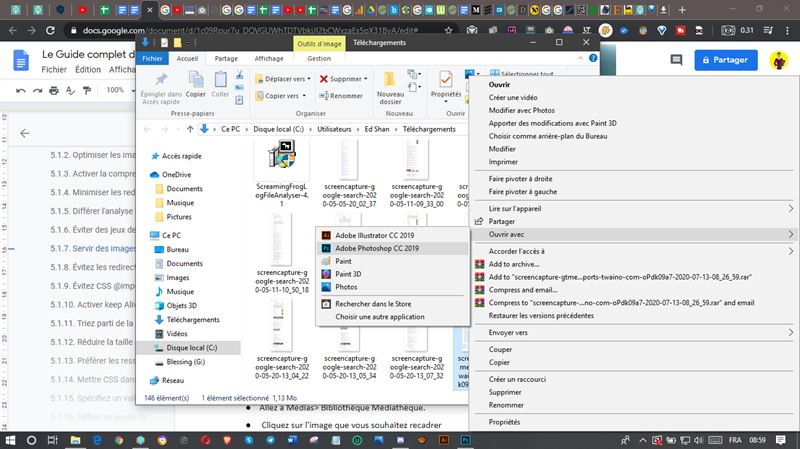
- In the menu, click on Image:
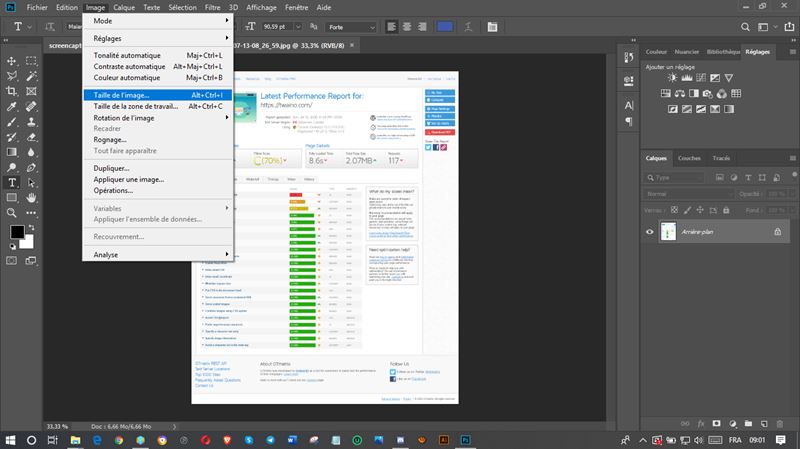
- Click on the size of the image, a new window will appear as follows:
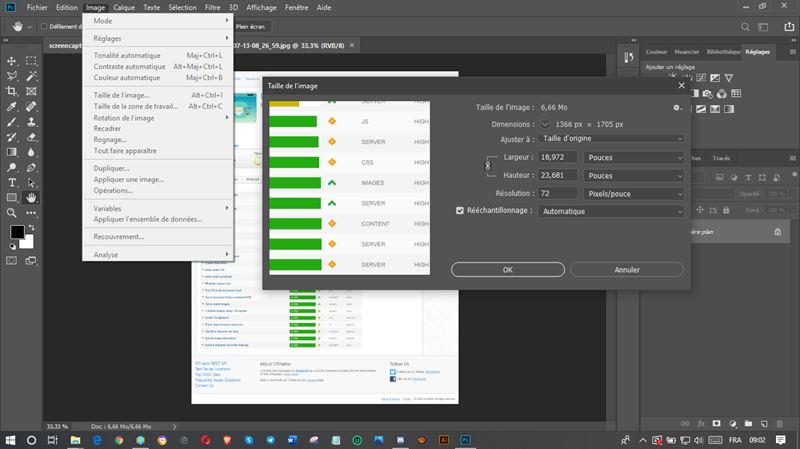
- Now modify the dimension of the image (width and height ) and save the new one:
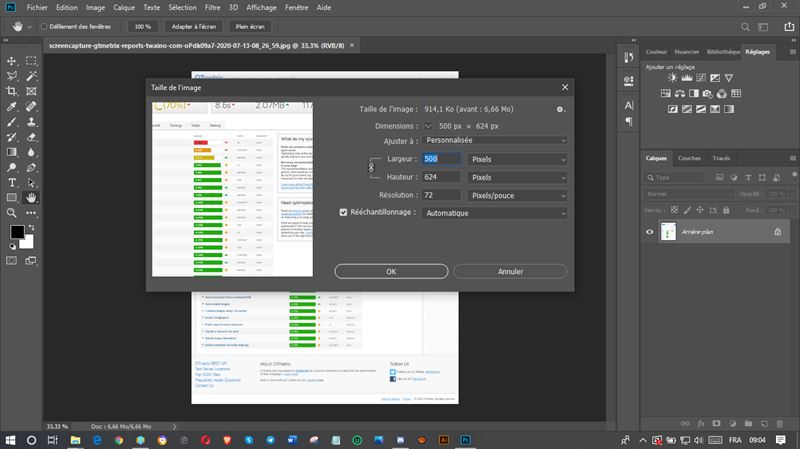
- Upload the new image to WordPress and replace the old one to display scaled images.
If you want to serve scaled images, you can manually crop an image with WordPress.
To do this, first login to WordPress Dashboard:
- to Media > Library Media Library:
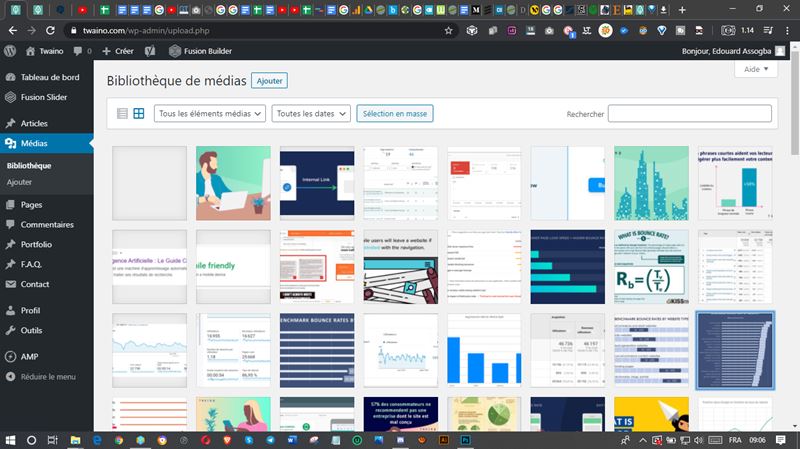
- Click on the image you want to crop:
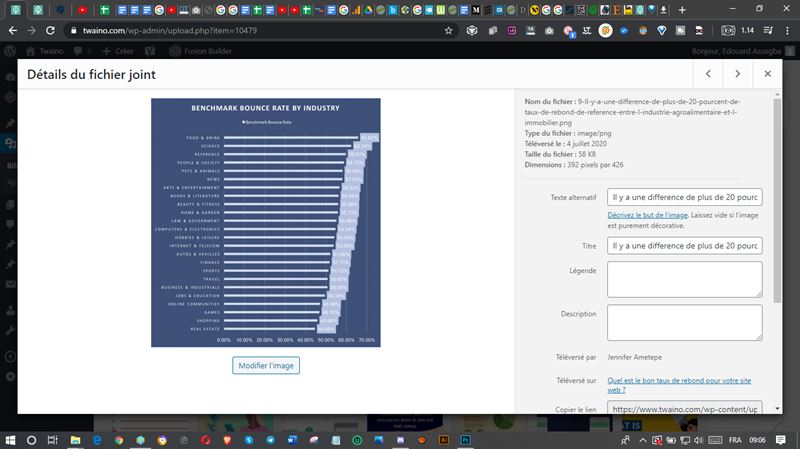
- Click edit image to open the editing interface:
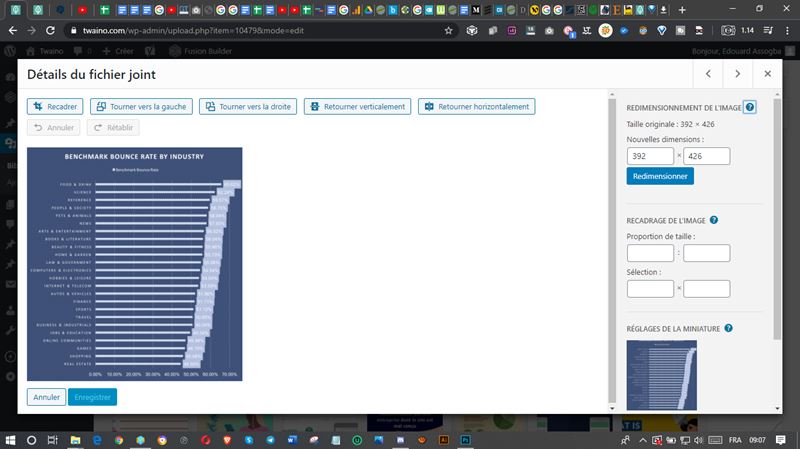
- GoScale the image by resize or crop the image using the corresponding options on the right.
5.1.8. Avoid redirects on the landing page
When you have moved an element of your site, for example, you need to redirect the old URL to the new one to allow Internet users to find what they are looking for.

However, these redirects can cause latency and therefore a poor user experience.
Indeed, redirections increase the number of requests to be sent to the server as well as the number of responses that it sends. These request-response surpluses must be reduced.

The reduction will therefore consist in reducing these redirections to what is strictly necessary.
You can solve this problem by:
Eliminating unnecessary redirects and to do this you must:
- Avoid referencing URLs that redirect to other URLs.
- Avoid using multiple redirects to access the same resource
- Minimize the number of URLs that issue redirects but don’t actually have content.
Another solution would be to use internal server-level rewrite to set up a redirect. Thus, when the client makes a request and this request returns to a bad URL, the server immediately remaps it to the correct one.
5.1.9. Avoid CSS @import
@import is a rule that allows you to import a stylesheet into another stylesheet.

The use of this property on your website, particularly with regard to external style sheets, will cause your page to load longer.
For example, if the external style sheet is:
- CSS external style
- sheet And this sheet contains the command
- @import URL (style sheet to import)
The browser downloads and parses and executes the style sheet.css file first before counting it has to download the style sheet to import. This is probably the cause of a longer loading time.
5.1.10. Enable keep Alive
This is a feature that keeps contact between two devices. Based on sending a message, this functionality allows the exchange of messages between two devices. The purpose of its messages is to verify the existence of a connection and to ensure that this connection is maintained.

As part of your website, the keep alive feature must be enabled between the server and the client.
To enable the Keep Alice feature when using an apache server:
- Just add the line: keep Alive On to your httpd.conf configuration file.
- You can also ask your host
- You can set it from your htaccess file by adding the line of code
<if Module mod_headers.c>
Header set Connections keep-alive
</ifModule>
5.1.11. Take advantage of browser caching
You can improve your website’s loading times by asking users’ browsers to save certain files on their first visit: This is browser caching.

This contributes to the reduction of the loading time of your website insofar as the loading time of the pages is reduced during a new use by the same browser.
Indeed, during your first visit, the site tells your browser to load certain static files from your site, store them and not download them if you return.
To configure this feature, you need to modify the HTTP headers to indicate timeouts for certain files.
In Apache:
Go to your htaccess file it is in the root of your domain, you can see it using an FTP client like Filezilla.
If you use WordPress:
You can activate this file by directly accessing your htaccess file. Htaccess files are hidden files that you can find at the root of your site in the www.
Using a text editor, modify this file by adding the following lines of code:
# Mise en cache des fichiers dans le navigateur
<IfModule mod_expires.c>
ExpiresActive On
ExpiresDefault « access plus 1 month »
ExpiresByType text/html “access plus 0 seconds”
ExpiresByType text/xml “access plus 0 seconds”
ExpiresByType application/xml “access plus 0 seconds”
ExpiresByType application/json « access plus 0 seconds »
ExpiresByType application/pdf “access plus 0 seconds”
ExpiresByType application/rss+xml “access plus 1 hour”
ExpiresByType application/atom+xml “access plus 1 hour”
ExpiresByType application/x-font-ttf “access plus 1 month”
ExpiresByType font/opentype “access plus 1 month”
ExpiresByType application/x-font-woff « access plus 1 month »
ExpiresByType application/x-font-woff2 « access plus 1 month »
ExpiresByType image/svg+xml « access plus 1 month »
ExpiresByType application/vnd.ms-fontobject “access plus 1 month”
ExpiresByType image/jpg “access plus 1 month”
ExpiresByType image/jpeg “access plus 1 month”
ExpiresByType image/gif “access plus 1 month”
ExpiresByType image/png “access plus 1 month”
ExpiresByType video/ogg « access plus 1 month »
ExpiresByType audio/ogg « access plus 1 month »
ExpiresByType video/mp4 “access plus 1 month”
ExpiresByType video/webm « access plus 1 month »
ExpiresByType text/css “access plus 6 month”
ExpiresByType application/javascript “access plus 6 month”
ExpiresByType application/x-shockwave-flash “access plus 1 week”
ExpiresByType image/x-icon “access plus 1 week”
</IfModule>
# En-têtes
Header unset ETag
FileETag None
<ifModule mod_headers.c>
<filesMatch “\.(ico|jpe?g|png|gif|swf)$”>
Header set Cache-Control “public”
</filesMatch>
<filesMatch “\.(css)$”>
Header set Cache-Control “public”
</filesMatch>
<filesMatch “\.(js)$”>
Header set Cache-Control “private”
</filesMatch>
<filesMatch “\.(x?html?|php)$”>
Header set Cache-Control “private, must-revalidate”
</filesMatch>
</ifModule>
Be sure to set the expiration dates according to the update times of the different files on your website. When done, save the file.
You can also do this using a plugin.plugin WP Rocket or W3 Total cache, for example, can allow you to take advantage of browser caching.
5.1.12. Reduce HTTP request
size A high HTTP request size results in a large flow of requests.

You can therefore avoid this overload by reducing:
- Cookies : Limit the cookies that must be sent by reducing their sizes as much as possible to less than 1000 bytes. Google recommends that this size be less than 400 bytes.
- URLs : Avoid making URLs heavier by adding several parameters, this can increase their size to additional bytes. It is therefore necessary that you limit their sizes to just a few hundred bytes.
5.1.13. Prefer asynchronous
resources Asynchronous resources do not block the loading of the page since this resource is deferred until the web user’s browser finishes loading the HTML code.

You can work around this problem by making JavaScript asynchronous. To do this, you can use the Async property of HTML on external scripts by adding:
<script async sec=”my.js”>.
You can also use a script dom element to promote the asynchronous loading of pages at the browser level of your users.
5.1.14. Put CSS in the head part of the document
Moving style elements into the HTML document allows them to be downloaded first. This allows browsers to gradually display a page.

Failure to comply with this recommendation may result in blocking of the rendering of the page by the browser and even displacement of content.
To put CSS in the head of the HTTP document:
- You must use the link in the <head> of your HTML document for external style sheets.
- You must also specify the style sheets in the correct order. For that, you need to use the <style> in the <head> part.
5.1.15. Specify a cache validator
This note means that there is no HTTP caching header included in your server. To correct this problem, you can use the following headers:
Last modified : This header allows you to see if the file in the browser cache has been modified since the last visit. To see the value of this header, you can use the Chrome dev Tools
Cache control : it is composed of directives with which you have the possibility to define the length of the cache.
The most used directives are:
- Max-Age which allows to define the cache duration of an element;
- Public which allows a cache to publicly store a response;
- Private which allows an element to be cached only with the browser that accesses the file.
Expires : To set the header to expire, you need to add the following line of code to your htaccess file.
## EXPIRES HEADER CACHING ##
ExpiresActive On
ExpiresByType image/jpg “access 1 year”
ExpiresByType image/jpeg “access 1 year”
ExpiresByType image/gif “access 1 year”
ExpiresByType image/png “access 1 year”
ExpiresByType text/css “access 1 month”
ExpiresByType application/pdf “access 1 month”
ExpiresByType application/javascript “access 1 month”
ExpiresByType application/x-javascript “access 1 month”
ExpiresByType application/x-shockwave-flash “access 1 month”
ExpiresByType image/x-icon “access 1 year”
ExpiresDefault “access 7 days”
## EXPIRES HEADER CACHING ##
5.1.16. Define a character
set The character set is used to represent characters by numbers.
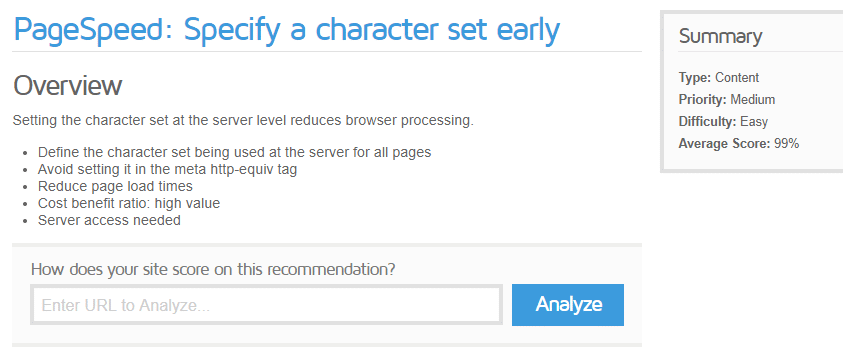
In the ASCII character set, for example, the numbers 0 through 127 are used to represent all English characters and special controls.
Specifying a character set is useful in that it allows HTML parsing and script execution to begin. The non-existence of a character set leaves the browser to do it itself, it can take longer.
To specify a character set you can define it at your server level by sending a content type header using the command line:
Text/html; Charest = UTF-8.
5.1.17. Embed JavaScript for small sites
It is not recommended to embed JavaScript as it may increase the loading size of your website.

However, if it is a small website, integrating JavaScript can improve your performance.
To be able to install it, I suggest you use the Autoptimize :

This is a free tool that gives you access to several options for optimizing your site.
To use it, just go to the options reserved for JavaScript and check “Aggregate JS Files”, which will combine all your java files into one.
5.1.18. Minimize HTTP requests
The loading time of your website in a user’s browser can be affected if there are more images or media to load.

This is justified by the fact that the HTML/HTTP protocols do not simultaneously transfer a high amount of resources.
To remedy this problem which undoubtedly affects the speed of your site and the user experience, you must opt for a reduction in the number of HTTP requests.
To do this, here are three solutions:
- Combined files : this trick consists of combining all the scripts into a single script and all the CSS files into a single CSS style sheet.
- CSS Sprites : This method is the most used when it comes to reducing the number of HTTP requests. It consists of putting several images in a single image file. Thus, to optimize the site, you can, for example, combine all the background images into a single image and use the CSS background image and CSS background position properties to display the desired image.
5.1.19. Make requests without cookies
The content of your site can be defined in static content and content with cookies. If for static requests, cookies are requested, this causes more network traffic and therefore more loading time.

Thus, when at the end of your performance analysis, Yslow recommends that you make requests without cookies, the solution consists of:
- Creating a subdomain and transferring all your static content to it, taking care not to define any cookies;
- Buy a new domain and move all your content without adding cookies.
5.1.20. Reduce DNS Lookups
The DNS (Domain Name System) is a directory. So, once you connect to the internet and enter the address of a site, the DNS looks up that site’s IP address and allows you to access it.

While searching for the IP address, your browser cannot download anything from the site. The number of DNS searches when an Internet user wants to access your website for the first time is equal to the different host names on your page.
Concretely, these are the hostnames used in the URL, images, scripts, style sheets, etc.
Since searching for all of these items takes more time, it would be best to split your page components across two or three hostnames to create a trade-off between DNS lookups and response time.
5.1.21. Avoid 404 Not Found Errors
The 404 error is a message used by the HTTP protocol to tell the browser that for a given request, no resource was found.

But knowing that HTTP requests increase your site traffic by wasting server resources and providing bad user experience, it would be better to avoid them as much as possible.
5.1.22. Reduce the number of DOM elements
First, the DOM is an element that defines the structure of an HTML page. According to Google Page insights it is excessive when its size exceeds 1500 tags:

A larger DOM will require more memory both at the level of your browser and at the level of the style sheets. To reduce the DOM, the solution would be to reduce the size of your HTML page to simplify the elements and therefore the loading time.
Here is a video to go further:
5.1.23. Configure E-TAG
entity tags E-tag entity tags are an HTTP protocol that are involved in the recognition and validation of items stored in the cache.
Indeed, these tags make it possible to know if an element located in the cache corresponds to that of the origin server. Validated items can be images, code, scripts, etc.

So if between two visits an element has been modified on your site, the server and the end user’s browser will have different E-tags and the file will therefore be sent back. Otherwise, the file is no longer sent, which therefore contributes to the rapid loading of the page on the Internet user’s screen.
5.1.24. Use a CDN content distribution network
This is a set of computers connected in a network and which communicate in order to make content available to users. These are actually geographically dispersed servers, thus offering proximity to Internet users.

This proximity promotes the speed of loading of your web page. The CDN is not only recommended to load your content quickly, but also to allow pleasant use of your site on a global level.
Akamai is an example of a CDN provider.
5.1.25. Add expired headers
The expired header asks the browser if they should send a file to the server or retrieve it from the browser’s cache.

The objective is to prevent the browser from downloading a file that has not been modified and therefore to save loading time and to quickly load the web page.
To add expired headers:
- You can refer to using expires headers for statistical data;
- You can use the strategy using the Far Future header.
For dynamic components, use the cache control header instead:
To set up the expires header, you can add the following lines of code to your htaccess file:
## EXPIRES HEADER CACHING ##
ExpiresActive On
ExpiresByType image/jpg “access 1 year”
ExpiresByType image/jpeg “access 1 year”
ExpiresByType image/gif “access 1 year”
ExpiresByType image/png “access 1 year”
ExpiresByType text/css “access 1 month”
ExpiresByType application/pdf “access 1 month”
ExpiresByType application/javascript “access 1 month”
ExpiresByType application/x-javascript “access 1 month”
ExpiresByType application/x-shockwave-flash “access 1 month”
ExpiresByType image/x-icon “access 1 year”
ExpiresDefault “access 7 days”
## EXPIRES HEADER CACHING ##
5.1.26. Avoid the Alphaimageloader filter
This is a filter that solves problems with PNG files in Internet Explorer versions lower than 7.
But sometimes this filter blocks the rendering of the browser during the image download.

To avoid this problem, Yslow recommends that you favor the PNG8 gradient instead. However, if you really want to use this filter, it would be better if you used the “filter” underline hack.
5.1.27. Reduce CSS
expressions CSS expressions are properties that allow you to add JavaScript to your style sheet.

width : expression (500 + « px ») ;
width : expression (document. body. clientWidth > 600 ? « 600px » : « 100px ») ;
They can create problems loading your page since the expressions are frequently evaluated. Thus, to overcome this problem, a solution would be to use a single expression or a handler.
5.1.28. Use Get for ajax
requests GET and POST requests are HTTP requests used to both receive and transmit data.

When making an XMLHTTPRequest type request, it is better to use Get instead of post.
Because post sends headers and data in two steps while Get sends data and headers together.
However, the use of the header is no longer possible when the URL exceeds 2 KB.
5.1.29. Allow AJAX Data Caching
Ajax stands for: Asyncronous JavaScript and XML. This form of requests allows you to send asynchronous requests to the server.

However, since their use does not guarantee that the user does not have to wait, it would be better to improve the answers to optimize the waiting time.
Fixing this problem can be done by adding an expires or cache control header.
5.1.30. Remove JavaScript and CSS duplicates
During the coding of your website, it may happen that you insert the same JavaScript or CSS code twice. This could be the cause of your site not loading properly.

This is because duplicate JavaScript and CSS files can create unnecessary HTTP requests in users’ browsers. Scripts are evaluated multiple times resulting in redundant execution and wasted time.
To solve this problem, you can make arrangements by integrating a script management module into your HTML page using the script tag.
<script type=”text/JavaScript”
You can also do this in PHP by creating the insertscript function.
<? PHP riot insertions (“menu.js”)?>
Here is a video that shows how to do it:
5.1.31. Reduce the size of cookies
Cookies are items sent by a web server and stored on your computer. They inform the server of your browsing habits.

They can be used for:
- Recording your browsing habits;
- You connect to a website;
- Save your preferences for a site.
Their size is important for the performance of your site since the cookies set can accumulate and increase the size of your site.
To reduce the size of cookies, you can take the following actions:
- Delete unnecessary cookies;
- Set the cookie size to the lowest possible value;
- Set cookies at the appropriate domains;
5.1.32. Put Java script at the bottom of the HTML document
As you already know, JavaScript blocks the normal loading of your website.
When you place it at the top of the page, browsers execute it before loading the rest of the page. You can therefore remedy this state of affairs by moving your scripts to the bottom of the page.
You can do this using a plugin: “JavaScript to footer”. It will be enough just to activate it so that your scripts are moved downwards.
5.1.33. Use JavaScript and CSS externally
Using Java and CSS files externally causes them to be cached by the client browser, this reduces the size of HTML requests and therefore allows your page to load faster.

Using css in an external file is easier and more flexible, unlike inserting it directly into a page. To use CSS externally, start by creating a file that will bear the name of styles to which we add the CSS extension.
Once the file has been created, it must be added to the page of your site using the <link>
Using the line of code:
< Link> rel= “stylesheet” href=” style.css”\>
To use Java from an external file, you must start by creating your file to which you will add the Java extension (. JS)
Then at the level of your HTML page, you add this script using the tag < script>
Using the line of code:
<Script src=” path/to/the/script.js”></script>
5.1.34. Make the favicon small and enable its caching
The word favicon was born from the contraction of the English words favorite and icon. It designates the icon file. In short, it is the icon that symbolizes your website.
This feature was introduced by version 5 of the Internet Explorer browser before being taken into account by other browsers.

So, as a feature, it is requested by the client’s browser from the server. If it is absent, it causes a 404 error while if its size is large, it requires a lot of effort from the server, which can be the cause of slow loading of your website.
To avoid this problem, you will have to ensure that the size does not exceed 1 KB. You can cache it by setting the expires header.
5.1.35. Avoid resizing images in HTML
The use of HTML to define the size of images, in particular the height and width attributes, is not a good idea since they lead to an increase in the size of these images.
As a result, when downloaded by the client’s browser, the images become larger, which adds time to the loading of the page of the visitor’s browser.
5.1.36. Avoid empty
src or href src and href are HTML attributes, they allow you to define the conditions of existence of an element (video, images, texts).
attribute src allows you to indicate the source of an element while the href allows you to indicate the path by which to access this element.
When you leave these two elements empty, in your page, you can expect users’ browser silence.
Indeed, when the src and href are not defined, browsers send several requests to the server. This is the cause of high traffic on the servers, thus blocking the loading of the page.
Here is the almost exhaustive list of recommendations that Gtmetrix generally gives. Here are some additional tips to use:
5.2. How to optimize your WordPress site with plugins?
Using code to improve your site can get awkward because it takes a lot of effort. It is in this perspective that I also suggest that you optimize your sites:
5.2.1. Install gtmetrix or not
After analyzing the speed of your WordPress site, you realize that the loading time is high.
Let’s see how to optimize the speed of your website by using the Gtmetrix plugin.
Before you begin, you will need to know your:
- Domain name;
- Credentials to your WordPress site.
Once you have logged into your dashboard, go to the left menu, find and click on plugin and select add new plugin.
Once done, search in the new window that appears in front of you for the Gtmetrix plugin. As soon as you find it, install and activate it.
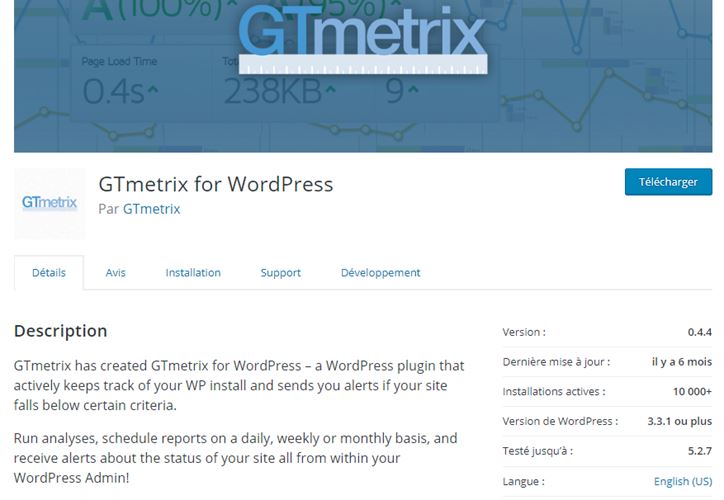
Now that your WordPress site has the WordPress plugin, you can start the optimization process. For this you would need to register an API key.
To do this, simply go to the gtmetrix site and register by entering your email. After registration, copy and paste your api key and insert it in the field indicated at the WordPress level.
Save changes. Go back and into the Gtmetrix plugin settings and perform the tests. If your API is installed correctly, then you will see your score. Otherwise, resume the API installation process.
Moreover, if your API is correctly installed, you will see the test results of your page. From the recommendations, optimize your site to make it better.
The purpose of installing the Gtmetrix plugin is to display the results of your site’s analysis directly on your dashboard.
However, before proceeding with the various modifications, it would be wise to save the current version of your website.
For this, you just need to install and activate the UpdraftPlus.
This plugin allows you to have a complete backup of the latest version of your website, whether it is:
- The database;
- plugins;
- Themes ;
- From your downloads.
Once done, you can restore your site if an error occurs during optimization.
As a result of this, you can see in your analytics what practices Gtmetrix recommends you perform to improve your site’s loading speed.
Depending on each optimization guideline, you can use plugins to fully optimize your site.
5.2.2. WordPress plugins to improve the speed of your website
Here are some WordPress plugins that will help you set up your site to get fast loading results.
Plugin 1: CDN Enabler

The free CDN Enabler plugin is used to deploy KeyCDN.
Fast and lightweight, this plugin allows you to:
- Link assets to load from a CDN;
- Define directories;
- Set exclusions (directories or extensions)
- Enable or disable CDN for HTTPS.
Plugin 2: CAOS

The free CAOS plugin is used to synchronize Google Analytics locally. It Complements Analytics Optimization Suite and allows you to locally host analytics.js/gtag.js/ga.js and keep it up to date.
Also, whenever you run an analysis of your website on Google Pagespeed Insights, Pingdom, or Gtmetrix, it tells you to use the browser cache. The cache expiration time has been set to 2 hours.
Because of this, the CAOS plugin will give you a higher score on Pagespeed and Pingdom and makes your website load faster because the user’s browser doesn’t have to go back and forth to download the file from the server. external to Google.
It allows among other things:
- To modify the order of queuing;
- Set the cookie expiration period;
- To force the disabling of display settings;
- Add tracking code to header and footer manually.
Plugin 3: Perfmatters

The performance plugin used to get rid of unnecessary HTTP requests and disable things like Emojis and ‘Embeds’.
Plugin 4: González

Gonzales allows to conditionally disable CSS, JS and even plugins depending on the page you are visiting.
It is a simple and lightweight tool with which you can get rid of an overloaded website by excluding unnecessary CSS and JS files saved.
To use it, you have to pay for a license, the price of which varies between $29 and $199.
Plugin 5: Imagify

The Imgify plugin allows you to optimize your images directly in WordPress. Once enabled, all of your images, including thumbnails, can be automatically optimized when uploaded to WordPress.
You can also use Imagify to convert web images for free.
It is not free however, it allows you to optimize up to 25 MB of image per month. The paid option allows you to optimize between 1gb and 50 Gb of image per month.
Lets you choose an image file and optimize it;
- It supports PDF files;
- Can easily regenerate your thumbnails;
- Optimize the images of the theme you have activated on your WordPress site;
- Can support multiple API keys.
Once you are done making the various settings, scan your site again on gtmetrix.com or with the plugin to see the changes.
This list of plugins is not exhaustive, there are still others that will allow you to solve several other optimization problems. I will complete them as I discover them.
Although Gtmetrix is an exceptional and powerful tool for analyzing the performance of your website, I present to you other analysis tools.
Chapter 6: Other website performance analysis tools
In this chapter, I present some website performance analysis tools. I will also make a comparison with the Gtmetrix tool.
6.1. Other tools to analyze the performance of your website
6.1.1. Dareboost

Dareboost is a performance analysis tool that can be used to analyze your website. It can run fine in multiple browsers both on pc and mobile.
It analyzes your website and gives a score out of 100 points. It also displays the corrections and optimizations that you need to make to your site.
Dareboost has several features and characteristics. Especially since it not only allows you to test the speed of your site, but also to monitor, compare and set alerts for your websites.
When you perform an analysis with dareboost, you have access to several information including:
- The best practices you should adopt;
- Some information on the state of your site in relation to compliance with web standards;
- Information about the type of server, CMS or frameworks you use on your site.
- The practices you follow.
- A summary table that gives you the score of your page, the browser from which you perform your test, server location.
Even though you can find a lot of data for free, the tool offers three plans:
The “performance” plan worth 310 euros per month this plan allows you to:
- Generate unlimited reports
- Automatically monitor 15 web pages
- Set analysis monitoring at a frequency of 30 minutes
- Keep your data for 6 months
- Share your accounts with 10 people
- Access 13 test locations
- Perform consultations and analyzes using an API.
A business plan: this plan has a value of 49 euros per month, it gives you access to:
- Unlimited analysis reports
- Monitoring of 5 web pages with a daily frequency
- Retention of your data for 6 months
- Sharing of your data with three people
- Consultation and analysis using an API
- Access to 13 test locations
A customizable plan that allows you to configure your choices. However, this default plan costs 19 euros per month and allows you to do:
- 50 analyzes per month.
- Automatic monitoring with daily frequency Storage
- of your data for 1 month
- Sharing of your data with a single person
- Consultation by API and access from 13 test locations.
6.1.2. Pingdom

Pingdom is a site that offers monitoring of websites to warn of their latency. It offers actions such as:
- Synthetic monitoring: To monitor the user experience of visitors to your websites.
- Monitoring of real users: To improve the performance of your site based on information collected about them.
Pingdom can also create alerts to inform you of the results of your website by email.
The Pingdom monitoring suite is available starting at $42 per month. The site currently offers a free trial with a price of $10 a month for each monitoring option.
Renowned for its ease of use, pingdom lets you test your site’s speed from seven locations:
- Japan
- Germany
- England
- Brazil
- Washington
- Australia
- San Francisco.
When you analyze the performance of your site with this tool, you will get information about:
- The score;
- loading time;
- The total size of the scanned page;
- The number of requests;
- The location of the test;
- The percentage of sites that your score is higher.
Apart from scores, pingdom analysis also reveals HTTP status codes to you. This is a message used to indicate the success or failure of a request. There are three pingdom codes:
- Code 200 to notify that the request was successful;
- 301 codes for a request whose resource has been moved
- 404 codes for a request whose resources have not been found.
After the HTTP response codes, you now have the content size which can be:
- By type of content;
- Or by domain type.
As you can imagine, the higher this size, the more it will mean that your website must be optimized.
The final piece of pingdom analysis is waterfall charts. These are also cascading elements that provide information on all the queries available on a website.
6.1.3. Uptrends

Uptrends is a website performance analysis tool that lets you optimize your website by monitoring:
- Your website page;
- Web applications;
- Web performance;
- APIs;
- Actual users;
- The server.
It offers 5 plans divided into two categories.
The first has 3 plans whose services are already predefined.
They are:
- Starter plan: it costs $12.02 per month and allows you to monitor 10 URL addresses;
- The bonus plan is worth $34.52 with an offer of 50 web pages to watch;
- The professional plan is worth $168.27 and lets you monitor 250 web pages.
- The last two planes are a defined by yourself. However, the business plan starts from $28.79 per month, while the “enterprise” plan starts from $52.08 per month.
The Uptrends software allows you to analyze a website based on several criteria. It then provides a cascading analysis of the page elements.
6.1.4. Google PageSpeed insight

This is a free tool offered by Google to measure the loading speed of your website. Once you enter your URL address, this software analyzes your site and generates conditions to increase this speed.
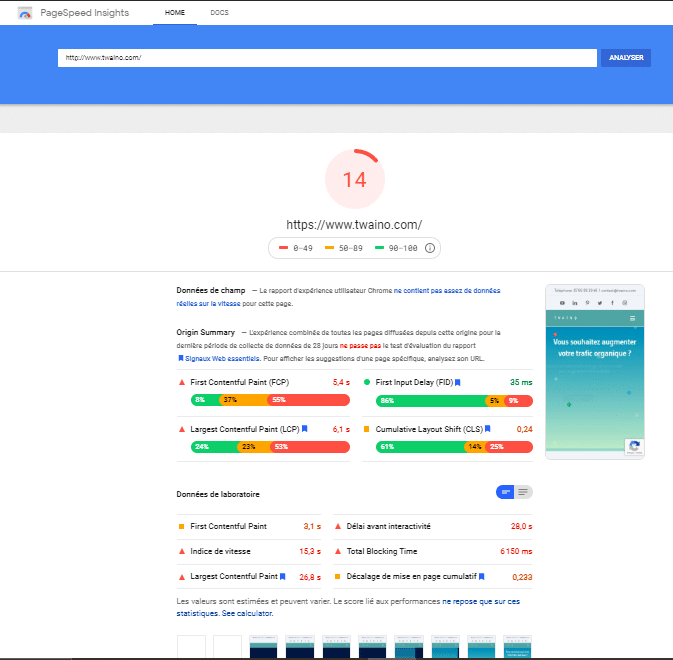
The results obtained through pagespeed insight are obtained thanks to the data provided by:
- The First contentful Paint: The moment of the appearance of the first image or the first text;
- Speed Index: How quickly the page is available;
- The largest contentful Paint: When the largest image or text is displayed;
- The delay before interactivity: The time it took for the page to become completely interactive
- The total blocking time: The sum of all the delays between the FCP and the delay before interactivity;
- Cumulative Layout Shift: The movement of visible elements.
The second part concerns the suggestions which gather all the recommended practices to increase the speed of your site.
6.1.5. test webpage

This is a free tool that allows you to run a page load speed test from multiple locations on earth and through browsers such as Internet Explorer and Google Chrome.
Once on the site you have the possibility to do a simple or advanced analysis. Anyway, you have the choice to determine several options such as the navigation parameters, the place of the test and many other options.
An analysis on web page test allows you to have three different graphs which represent:
- The test parameters and the results of the potential analyses;
- The breakdown of the main features of your site;
- The overview of the structure of your pages.
6.1.6 Test my site

This is a platform for analyzing the loading performance of a mobile website.
Easy to use, it is a solution to understand the problems of viewing a site on mobile.
Included are page load times and several tips to improve optimize site loading.
6.1.7. Key CDN website test

Key CDN is also a website speed analysis tool. It offers a 14-day free trial that allows you to perform your speed tests from 10 different locations namely:
- Frankfurt;
- Amsterdam;
- London;
- New York ;
- Dallas;
- Without Francisco;
- Singapore;
- Sydney;
- Tokyo;
- Bengaluru.
The tool allows to do besides speed and performance tests, an HTTP header check, an HTTP/2 test and a brotli test.
The analysis carried out gives the following result:
- A score;
- Page load time;
- The loading size;
- The number of requests.
Next, the tool displays best practices for website optimization with performance grades.
You also have diagrams representing the different types of content requests (by type, by domain). As well as the size of the contents by size, by type and by domain.
You also won’t miss the detailed query display at the waterfall tool.
6.2. Comparison of Gtmetrix with some analysis tools
In this part, I make an analysis between Gtmetrix and some tools presented in 6.1. to identify the tool best suited to an analysis of the speed of websites.
The tools I take into account in this comparison concern the pingdom tool, pagespeed insight, webpagetest and gtmetrix.
6.2.1. Gtmetrix vs Pagespeed insights:
Regarding the commonalities, it should be noted that:
- Gtmetrix and Pagespeed insights allow mobile tests;
For the price, Gtmetrix is paid while pagespeed Insights is free; - You cannot set the test location on the Pagespeed tool while setting a test location is possible on Gtmetrix;
- Pagespeed does not limit the connection or the number of tests unlike Gtmetrix.
6.2.2. Gtmetrix vs Pingdom:
Both tools are known for their ease of use. Both of them allow setting a test location, running scans on mobile and they also offer free plans.
While the smallest subscription price is $14.95 at gtmetrix, it’s $42.12 at pingdom.
6.2.3. Gtmetrix and webpagetest
Webpage test is a completely free and open source tool. It authorizes in the same way as Gtmetrix the definition of a test location, the limitation of the connection, the mobile tests.
That said, Gtmetrix is paid for and offers much more advanced options.
There you go, you are done optimizing your website speed with Gtmetrix.
In summary
Gtmetrix is a tool for analyzing the speed performance of your site that will meet your expectations. It already offers you in its basic version a plurality of features that give you an overview of the state of your site.
With such a tool, you can, for example, monitor and set an alert on your page so that when the performance of scores drops, you are automatically notified to correct the errors.
Which would be very good insofar as you will have the possibility of always keeping your site fast. And thus offer your customers a site that always loads quickly.
In this article, you have also had the opportunity to go through the various recommendations of Gtmetrix as well as the various tips to implement them.
I hope they have helped you optimize your website and get a lot more traffic.
In case you have difficulties, you can always contact or hire an SEO professional.
See you soon !


