An infographic is an image that includes information and data combined from images, charts, graphs, diagrams and other graphic icons to provide lengthy information. It is an effective way to present data and explain complex issues in a concise and useful way to users.
Backlinks play a key role in a website’s SEO and webmasters implement all kinds of strategies to generate these links. Among these strategies, the publication of infographics is very effective.
Indeed, content containing infographics generates 178% more links and 72% more traffic than standard content. Faced with these statistics, more and more webmasters are making the creation and publication of infographics part of their content strategy.
Through this article, we discover together the definition of infographics and their benefits in terms of SEO.
We will then go through some tools and tips to create impactful infographics that generate a lot of backlinks.
Finally, we will see how to publish an infographic so that visitors and bloggers share it on other sites as well as on social media.
Chapter 1: Infographics – What are they?
As part of their SEO strategies, webmasters use many techniques to create content and several formats to present their information. In this chapter, we discover:
- The definition of an infographic;
- The different types of infographics;
- The importance of infographics in SEO.
1.1 What is an infographic?
The term infographic is a combination of the words “info” and “graphic”. It is a representation of information and data in a visual form.

This way of presenting information allows users to better understand and interpret it. An infographic can combine both,
- Tables ;
- Graphs;
- Diagrams;
- Text.
Infographics can display a lot of information and large texts in a precise way to make them useful to users.
The use of infographics to convey information instead of magazines has great impacts on websites. It effectively conveys information and allows a website to attract traffic.
Although infographics have been around for decades, they have gained popularity with the rise of social networks like Facebook and Pinterest. It makes long articles and texts that seem boring more interesting as well as very appealing.
This is because the human brain processes visual information much faster than textual information. This is one of the reasons why infographics have gained so much influence and popularity among internet users and on social media.
Statistically speaking, about 90% of users find graphic content generated for marketing effective. Moreover, infographics often reach 8 out of 10 users.
This means that infographics are likely to increase the chances of a successful marketing campaign.
As an example, Copyblogger published an infographic in 2012 called 15 Grammar Gaffes. Since its publication, this infographic alone has generated:
- Over 6,500 tweets;
- Over 60,300 Facebook likes;
- More than 2,000 LinkedIn shares;
- More than 500 comments
There are generally two forms of infographics: the traditional infographic and the action-based infographic. The former is the one that presents complex data in a way that makes it easy to understand.
The infographic below shows in a simple way the digital situation in the world in January 2020.

Webmasters often use infographics to reinforce their arguments. Traditional infographics allow webmasters to increase traffic to their sites and generate more backlinks.
As for the action-based infographic, it is presented as a step-by-step plan to solve a complex problem. Above all, it increases the number of conversions into subscribers and builds reader loyalty.

Whether traditional or action-based, infographics are a tool to educate and inform, but also help increase brand awareness.
1.2. The different types of infographics
1.2.1 Static infographics
This type of infographic focuses more on images and visual information than on long textual information. Static infographics are optimized to be displayed on computer screens and smartphones
They are mainly used to present products and other types of services. It is also used to transmit and present information on social media
1.2.2 Animated Infographics
This type of infographics is used to tell stories or present information and data in an attractive way.
They are mostly used to explain a process or functioning of a system as it is the case for action-based infographics. They allow to have control over the user experience
1.2.3 Interactive Infographics
This type of infographics allows you to optimize huge amounts of information and data in graphic form

Interactive infographics are commonly used to engage users for more interaction.
They allow you to visualize huge volumes of information and focus on specific information. These types of infographics have a very engaging and user-friendly profile in order to attract users and convince them to log on to the site.
1.3 How do infographics influence SEO?
1.3.1 Generating backlinks with infographics
Backlinks are links from third-party sites that refer their readers to your web page. Search engines determine the importance of a website by the number of backlinks it manages to generate.
The sites that receive the most backlinks are then treated as the most important. Therefore, these sites get better rankings in the SERPs than others.

Fortunately, there are many methods to generate backlinks to improve the ranking of a site. Infographics have proven themselves over the past few years as an effective way to generate backlinks.
Creating infographics is a powerful strategy for getting backlinks to increase traffic to a site and improve a domain’s authority.
According to studies, infographics can help increase website traffic by up to 12% and original infographics are the most successful content among the content.
1.3.2. The use of infographics as a marketing tool
Infographics are emerging as an indispensable tool for digital marketing. As mentioned earlier, they are enjoying unprecedented success on social media and people are becoming more interested in visual content.
For this reason, most organizations and marketers are working on using infographics as a tool to reach a large number of people online.

The best way to make an impact on these people is to ensure that your content provides value to them. This is what infographics can do by presenting information in a more attractive way.
This makes it easy for readers to grasp the message you are trying to convey without putting in much effort.
1.3.3. Helps to raise awareness of your brand
Infographics are suitable for getting a brand known to a target audience. This is because they increase the chance that your content will be remembered and thus leave a lasting impact on those who come across your infographics.
According to one study, three days after a presentation, people remember about 10% of the information they heard. In contrast, people retain up to 65% when an image is paired with information like infographics over the same time period.
Infographics are also an ideal format for conveying high impact information about a brand. When designed correctly, infographics can be a formidable communication tool to describe a brand.
For digital marketers, they significantly increase traffic to a website and increase brand awareness.
1.3.4. Infographics can be shared
Digital marketers get a lot of results with infographics. People often share infographics as is the case with Copyblogger where their visual has been shared over 2,000 times on LinkedIn alone.

Infographics retain their relevance and can still be shared months after their initial publication. Remember that user interaction with content is one of the key elements of an off-page SEO strategy.
Chapter 2: Some tips to create a captivating infographic?
Most websites are working on creating infographics to take advantage of the multiple benefits of this content format. A good infographic should be captivating and should be able to stand out on the web.
In this chapter, I will share 3 tips for creating captivating infographics;
2.1. Find the right method for your audience
The method used to create an infographic can affect its value. Webmasters can opt for
- The use of sequential data;
- Graphs;
- Flowcharts.
Regardless of the method you choose, it is crucial to tailor your infographic to your target audience. Indeed, the infographics that are likely to generate the most interest and virality are those that meet the expectations of a target audience.

For this reason, the title of your creation must be in line with your audience and the topic of your site. It’s obvious that your audience will like “how-to” infographics when they like “how-to” blog posts.
Some titles catch people’s curiosity and you can add to the title of your infographic, one of the words like:
- New Research
- New findings
- New Data.
2.2. Tell a unique and catchy story
To create a good infographic, it’s important to develop a compelling story that captivates the audience. It’s all about making an emotional connection with your readers. Using familiar imagery is one of the tactics to make that connection.
Even if you’re creating an infographic on a topic that isn’t new, a unique story will give it pizzazz and evoke emotions.
Visual storytelling is an art in itself, and you need to learn how to organize information in an order that makes sense to your target audience
Determining your starting point and your conclusion beforehand will allow you to get your audience from point A to point B.
People are generally interested in stories and the majority of the most interesting posts on Facebook are photos. Telling your story in a graphic format will make it even better.

When creating your infographic, it is possible to tell the story of the experiments you conducted and the strategies you used to achieve a result.
You can also use other people’s reliable research including statistical data to create a new story. The relevance of your story will depend on how creative your infographic is.
2.3. Statistical data
People aren’t often interested in infographics that are based solely on opinions. To build trust with your audience, you need to back up your claims with data from reliable sources.

Using reliable statistical values tells potential readers that you are not the only one who believes in a particular fact, but that there are other experts who can authenticate it.
Chapter 3: How to create an infographic that can generate lots of backlinks?
Creating infographics is a task once reserved for design professionals. Today there are many tools that allow you to create excellent infographics without much skill.
We discover in this chapter,
- How to find ideas for creating infographics?
- Simple tools to make infographics;
- How to make an infographic yourself or how to hire a professional?
3.1. find infographic topics that really work
A good infographic always starts with great content and provides potential readers with information :
- New;
- Relevant;
- Inspiring.

In addition, original content can get bloggers to repost your infographic and thus create backlinks to your site. However, how can you get your hands on exclusive content for your infographic?
3.1.1. Hot topics
Finding the hot topics is a great way to create an infographic that works. It’s all about finding out:
- What is currently happening in your niche
- What keywords you can target
- Are people talking about the topic you want to cover?
The answers to these questions make for an interesting infographic creation idea. Research tools like Google Trends and Alltop’s Viral can also help you find trending topics.
3.1.2. Ever-changing topics
There are a number of topics that never drop in popularity. These topics come back year after year in the forums. All you have to do is to find the topic that interests your target audience and that fits your site.
The strength of these topics lies in the fact that readers know about them, but still want to know more. These topics are also successful in growing markets where new people are entering.
For example, a topic that focuses on blogging will always be relevant as new people take up blogging every year.
3.1.3. Controversial topics
Controversial topics are also good candidates for an infographic. People love hot topics and you will be able to capitalize on them. It can be a topic like starting a business without investment.

This topic is controversial because it is debatable and people who read these headlines are curious if it is really possible to create a business without money.
3.1.4. The most viewed content
Content that works on other sites and gets a lot of views on YouTube are also great ideas for infographic creation
Just use data and pull information that can help your audience. You can also take inspiration from the titles of these popular contents to come up with an interesting title for your content.
3.1.5. Update your old articles
Creating infographics from your old successful content can help you double the traffic to your site. You will be able to update these successful contents on your site and take the opportunity to create an attractive infographic.
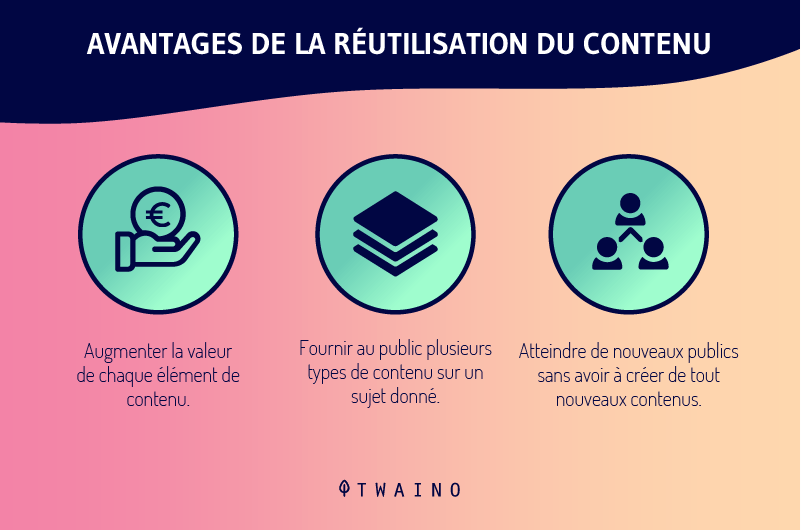
This strategy of using your articles can also be effective in improving the SEO of content that has not been performing well in terms of SEO.
These contents can be successful if you work on their optimization again. For example, you can revise the meta description and the titles, taking care to include the keywords.
3.1.6 Interview an influencer
Influencer marketing is booming and most companies want big celebrities or an athlete to endorse their product or become business partners.
In this context, creating an infographic from an interview with an influencer who can share interesting things with your audience can help you generate backlinks.
3.2. Some important points in preparing infographics
3.2.1. Fonts
It is crucial to be careful in choosing fonts, as they can affect the readability of your infographic. Therefore, you should try to use slang and legible fonts, so that they are both easy to read.

The font also reflects professionalism, which will influence the way ideas are communicated
Using multiple fonts in the same infographic can also detract from your design and it is advisable to use a limited number of fonts (usually two fonts).
3.2.2. The space between elements
The use of appropriate spacing in the writing and layout of images and elements improves readability. The distance between these different elements is not standard and it is up to you to find what is appropriate for your infographic.
For example, you can move related elements closer together to show their importance. By looking at other infographics, you will discover how certain elements can be placed in relation to each other.
3.2.3. The minimum amount of text
Infographics are usually used instead of long text. It is therefore important to use minimal text to avoid using large text in your infographic.

The texts that are likely to be used in infographics are texts that convey information in a simple way. The keywords to be used must also be chosen with care in order to show the importance of the theme to the readers.
To avoid overwhelming your infographic with text, you can use graphics and tables.
3.2.4. Shapes and design
Unnatural and non-standard shapes that may confuse the user should be avoided as much as possible. Good infographics are those with simple symbols.
When it comes to design, you should stay away from complicated and obscure designs. These kinds of designs reduce the users’ attention and focus on the main and important issues.
3.2.5. The colors
The use of colors in infographics increases the attention span by 82% and thus facilitates the memorization process. In addition, colorful messages are more likely to be remembered by 39%

However, it is not advisable to combine a lot of color in an infographic or to use a single color. You need to maintain a certain balance in the use of color in order to make the infographic appealing.
Using a single color does not distinguish the different important parts from each other and using multiple colors does not display the main content to the user.
3.3. Some tools to design an infographic
There are many tools that can be used to create an infographic, but we will look at those that are available to everyone.
3.3.1. PowerPoints
PowerPoint is a tool that is accessible to everyone both in terms of cost and use. This tool offers many customizable options that can help you make great infographics.

You can set a theme that will automatically ensure that your fonts and colors are complementary. It is also possible to customize the background by adding an image. Keynote is a similar tool to PowerPoint for Mac users.
3.3.2. Google Slides
Like the previous tools, Google Slide is also a presentation tool. It allows you to make infographics without much skill. The tool offers users several templates from which you can choose the one that best fits your theme.
Choosing a template in Google Slide to create an infographic is a ready-made process. The templates allow you to create amazing infographics with minimal effort by adding touches like:
- Text;
- Images;
- Graphics.
3.3.3. Photoshop and Illustrator
Photoshop and Illustrators are design software that will allow you to create customized infographics. The use of these two programs requires minimal skill and they are commonly used by professionals.
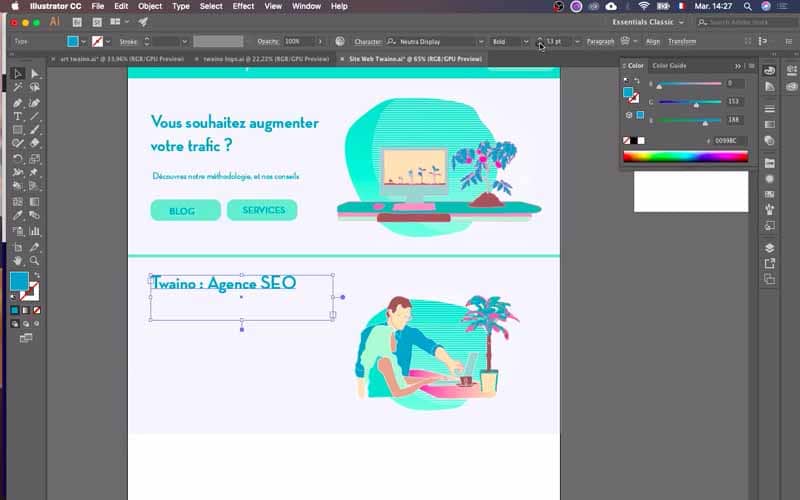
You can also find tutorials that will help you get to grips with these two software to create impactful infographics.
3.4. How to find icons and images for your infographic creation?
There are many sites that offer high quality icons and images with the aim of allowing designers to have control over their design.
As far as icons are concerned, Iconstore is a resource of free icons that you can use in personal designs
As for images, they are available on image banks like Pixabay and you will just have to search for the type of image you are looking for
Image banks like this one will help you avoid using poor quality images such as images that are too small or pixelated.
3.5. How to entrust the creation of your infographic to a design professional?
If you can’t make your infographic yourself for any reason, you can hire a professional. It’s very easy to find great graphic designers today without paying a fortune thanks to freelance sites like:
To find a graphic designer on one of these sites, just go to the site and type “computer graphics” in the search bar. The top rated graphic designers on these sites will appear and all you have to do is look at their profiles and choose your designer.

Some freelance sites may also have you write an ad for the service you want. The graphic designers will then come and offer their service and you can choose someone from among them.
When choosing a graphic designer from these sites, it is important to look at their previous work so that you can choose the one whose style matches what you are looking for and that of your brand.
In the absence of freelance sites, you can also entrust the creation of your infographic to an agency specialized in graphic design.
Chapter 4: Some practical advice before publishing an infographic
I share in this chapter, some tips that can help you avoid publishing a bad infographic.
4.1. Make the length and size of your infographic manageable
The quality of an infographic can degrade as it is resized. The font sizes used for the same infographic often vary. Sizing can affect smaller fonts so that they are not visible.

The readability of text on an infographic and the visualization of other elements are important especially when users do not enlarge it. For this reason, your infographic should be large.
However, a very large infographic can lose you readers. For example, a very long infographic can affect the attention span of the readers. Baclinko recommends a limit of 8000 pixels in length.
Size can also affect the weight of your file. The larger your infographic is, the more it weighs and may affect the loading speed. Some users have slow connections and infographics that take a long time to load can turn them off.
4.2. Check the facts and figures
The vast majority of infographic creators focus on presenting data, which is a smart idea.
The human mind processes statistics and percentages better when they are presented visually rather than numbers with commas. The image below illustrates this perfectly.

However, you need to make your infographic believable by making sure that:
- The statistics are true
- The sources are reliable
- The graphic representation of the data matches the numbers.
Verification of numbers and data is very crucial when your infographic is based on them. You should also mention in your infographic the sources of your data so that users can go and check.
When it comes to using statistics, make sure that you use the data that is up-to-date. Therefore, you should reserve using old data especially when your infographic is about an industry where information is constantly changing.
4.3. Name your infographic correctly
Webmasters should be careful not to name their infographic simply as“file_infographic_final.jpg“. It is essential to include in the name, a keyword that describes your infographic.
Search engines do not read the content of infographics, but rather are interested in the file name of the infographic. For this reason, it’s best to use a name like “keyword-infographic.jpg”.
Another strategy is to include in the file name, both the keyword that is a topic of the blog post and the information describing the content of the infographic itself.
This way, you help search engines understand what the infographic is about and increase its chances of ranking in image search.

Although it is not important for the SEO of your infographic, adding the Alt tag makes your infographic accessible to everyone.
Using the Alt tag in the HTML code of a page helps describe what an image represents. Users see the text in the Alt tag when the infographic is not loading
Chapter 5: How to publish and promote your infographic?
Publishing an infographic is up to the webmaster, and the method of publication can impact your SEO. Webmasters can publish their creation by uploading it to their site as an image or by using embedded HTML code.
In this chapter we will discover how to upload an infographic to a website and promote it.
5.1. Uploading the infographic to your site
The best way to publish an infographic is to create a new page or a new blog post. To publish your infographic, you must accompany it with a text that explains your procedure
This is because Google wants to see text on a web page and longer content tends to rank higher. According to a study, the highest ranked pages have an average of 2416 words.

The right strategy for publishing an infographic is to accompany it with text and embed code. This code allows visitors to easily share your infographic on social media or other sites.
Third-party sites that will share your infographic are required to link back to your site and this can increase your chances of ranking higher in the SERPs. Image embed codes are often generated by online tools.
Once you have created your infographic, you can generate your image embed code from our image embedding tool. This tool is designed to make it easy to promote visual content on third-party sites.
The following video shows how our image embedding tool works and how to embed this code on your site.
To finish publishing your infographic, insert a call-to-action to encourage them to share your creation on their site or social media. This formula can significantly increase the number of shares of your infographic.
5.2. Share your infographic
Distribution of your infographic is essential to get people to discover it so that you can reap its SEO benefits. To share infographics, social networks are powerful channels.
By determining which platforms have a better audience for your infographic, you will focus your efforts on them to ensure its success.
If your infographic is large in size, it is advisable to share small excerpts each time on social networks so that they are well suited.
You can also subscribe to ads on social media to reach many people quickly

On WordPress, you can make it easy to share your creation by using a social sharing plugin.
5.3. Contact bloggers and influencers.
This is the part you need to work on a lot. It involves contacting influencers and bloggers in your industry or related to your topic to share your infographic on their sites.
The ideal approach is to consult a list of 50 sites that are likely to be interested in your infographic. From then on, you can send them a message like below to make them aware of your infographic
“I created this infographic about [insert topic here], and I think your audience will really like it. Would you be interested in taking a look at it?“.
When the blogger responds, you can right now ask them to share the infographic on their site.
“Would it be of interest to your audience? I’d love for you to consider sharing it on your website or social media!“
5.4. Send to infographic directories
There are hundreds of infographic directories that you can submit your infographic to for publication. Most of these directories accept infographics alone
However, others may require a unique description to accompany your creation. These directories allow your infographic to reach a wider audience and are opportunities to generate backlinks.
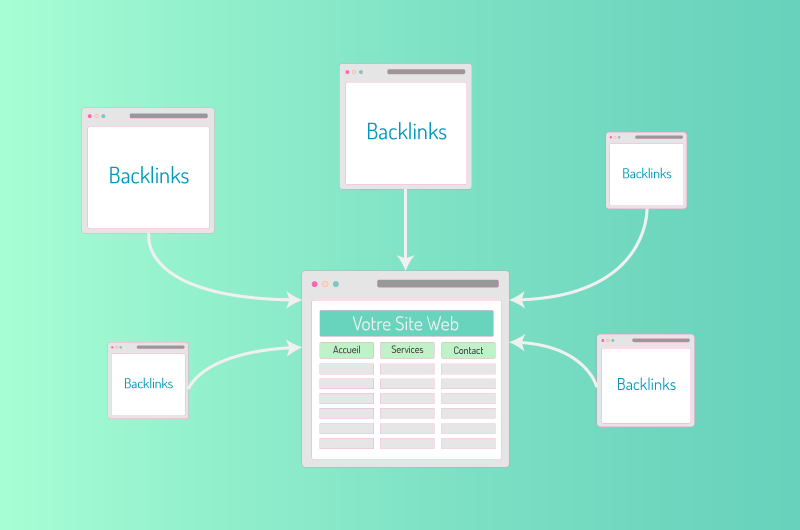
In fact, infographic directories allow you to link back to the original content and thus can help you generate more traffic. Graphs is a directory where infographic creators can publish their creation, regardless of the theme.
5.5. Other ways to promote infographics
In addition to these means of promotion, there are obviously other ways to get the word out about your infographic. For example, you can send out a press release and generate buzz.
Journalists are fond of information and press releases are a great way to create a debate around your infographic. It can also give your creation a chance to appear in a major online publication.

Guest posting is also a very effective strategy to not only get your infographic out there, but also to get backlinks from authority sites.
The guestography strategy is a form of guest article that involves images in infographic format. For Backlinko, it is a strategy that allows to increase links from referral domains considerably.
The guestography tactic allowed this site to increase the traffic of a web page by more than 179% in a month. The web page in question jumped from 2nd to 3rd place for the targeted keyword.

The guest posting strategy is as simple as guest articles. All you have to do is publish an infographic on your site and find sites that address similar themes to your infographic.
The next step is to show your infographic to the webmasters of these targeted sites and offer them unique content in exchange for a link to your site.
Conclusion
At the end of this article, it is worth remembering that infographics are an excellent way to generate quality backlinks and attract traffic to a website. Webmasters can use it to improve the overall SEO of their site.
Fortunately, the creation of infographics is within the reach of everyone and there are accessible tools to make beautiful designs. Moreover, there are many ideas to design an infographic that interest many people, whatever the field.
Infographics can also help webmasters to enhance their old content to increase their SEO potential.
The tips and tricks discussed in this article will allow you to create captivating infographics to entice people to share it.
If creating infographics has already helped you improve your SEO performance, feel free to share your experience in the comments.


