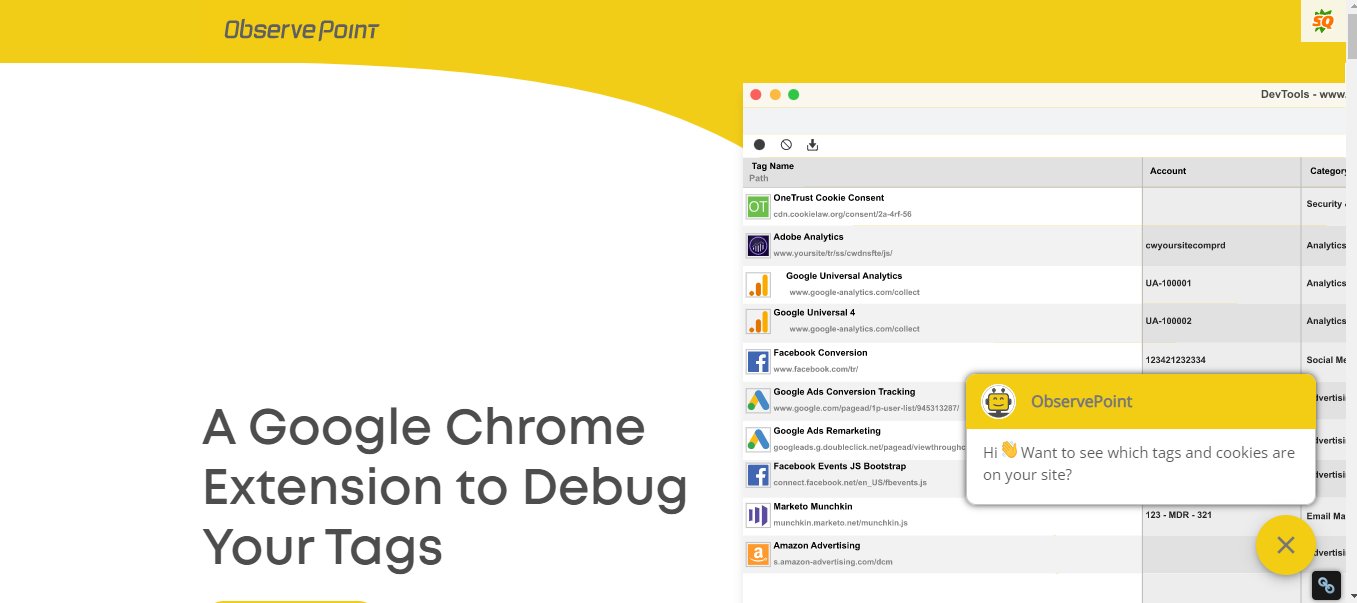
Short description : Debug your Tags
Do you need a simple and effective solution to check the functioning of tags on your website? This is the tool you need.
Long Description : Debug your Tags
Description of the tag debugger extension
Tag debugger is a free extension that you can find on the chrome web store. It provides troubleshooting for your analytics and marketing tags. But in reality, it is one of the solutions developed by the company ObservePoint for the analysis and monitoring of data on a website. It therefore allows you to have an idea of how third-party tags work on this website. Similarly, as you will notice, ObservePoint is a modern digital company that provides you with a range of innovative solutions for the collection and analysis of data present on the websites that you submit to it. These solutions range from managing the website’s digital and technological data, to debugging beacons, to bringing the site into compliance with privacy and improving advertising campaigns. In addition, Observepoint intends to satisfy you by emphasizing three essential elements, namely:- The quality of the data collected;
- Respect for privacy;
- And optimizing the experience of visitors to your website.
Who is the Tag Debugger solution intended for?
With all its possibilities, it goes without saying that the Tag Debugger tool is a solution that is best suited to natural referencing professionals or even webmasters. They will actually be in a better position to interpret and carry out the various actions required by the results of the debugging of the website tags.Why use a website tag debugging tool?
One of the main reasons that justifies the need for you to have a solution to ensure the debugging of the tags on your website is undoubtedly that it allows you to verify that these tags are not only well configured, but also that they work as they should. This could also be used in the context of carrying out certain verification tests. All this allows you to be sure that the tags are properly implemented and that there is no error closing the tags, or bad writing of the name of the tags or even a bad attribution of the attributes of each tag.What are its features?
In terms of functionality, it should be noted that the tag debugging tool for your website has several types of functionality. It allows you for example:- To perform quick checks on the tags that are placed on each page of the website;
- You can also inspect the variables of each tag;
- Monitor items with the click;
- And further export the collected data in a CSV format for future analysis.
How does the Tag debugger work?
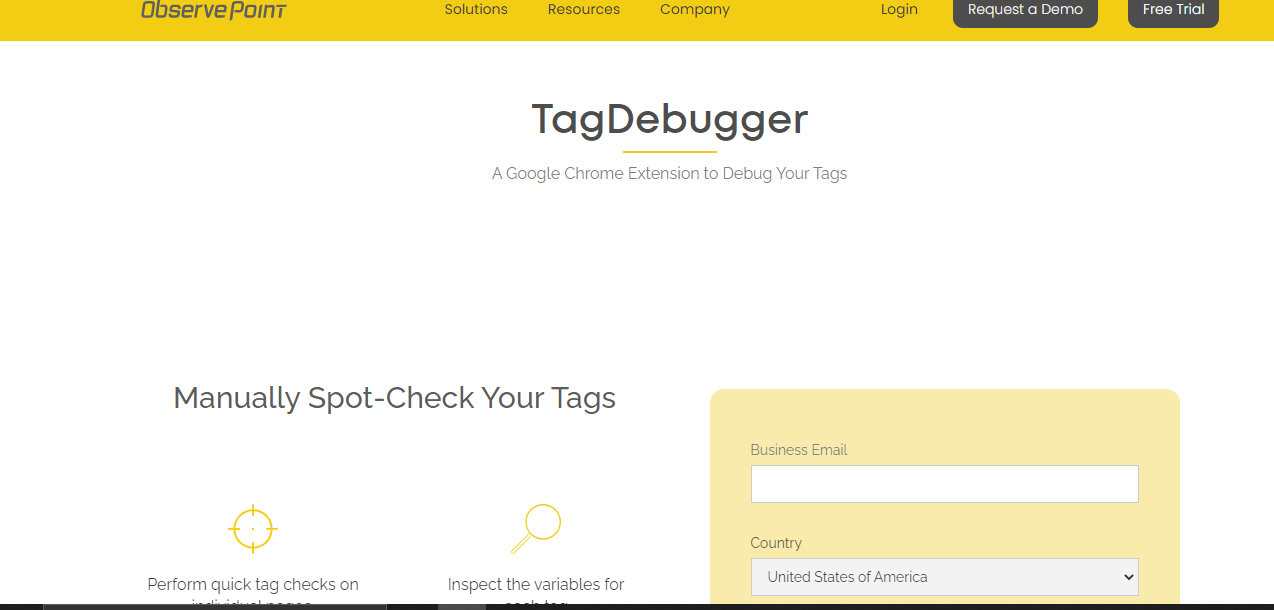
As for how the tag debugger tool works, it should be remembered that it all starts with adding the extension to your Google Chrome browser. The extension can also be added from the ObservePoint. To do this, you must go to the site, look for the solutions tab and select Tagdebugger. Wait for the new page that appears and fill in the information relating to your email, the domain of your site on which you wish to carry out your trial period and your country. As a reminder, the email you must enter must correspond to a professional email Then press the start your trial button to benefit from a trial period of nearly 14 days. During the trial period offered by the site, you have the chance to obtain access to many features. Anyway when you use the extension on a website, you can get the following information:- / path : this is the name that ObservePoint uses to uniquely identify each provider and each marking technology. The path is the tag request to the query string;
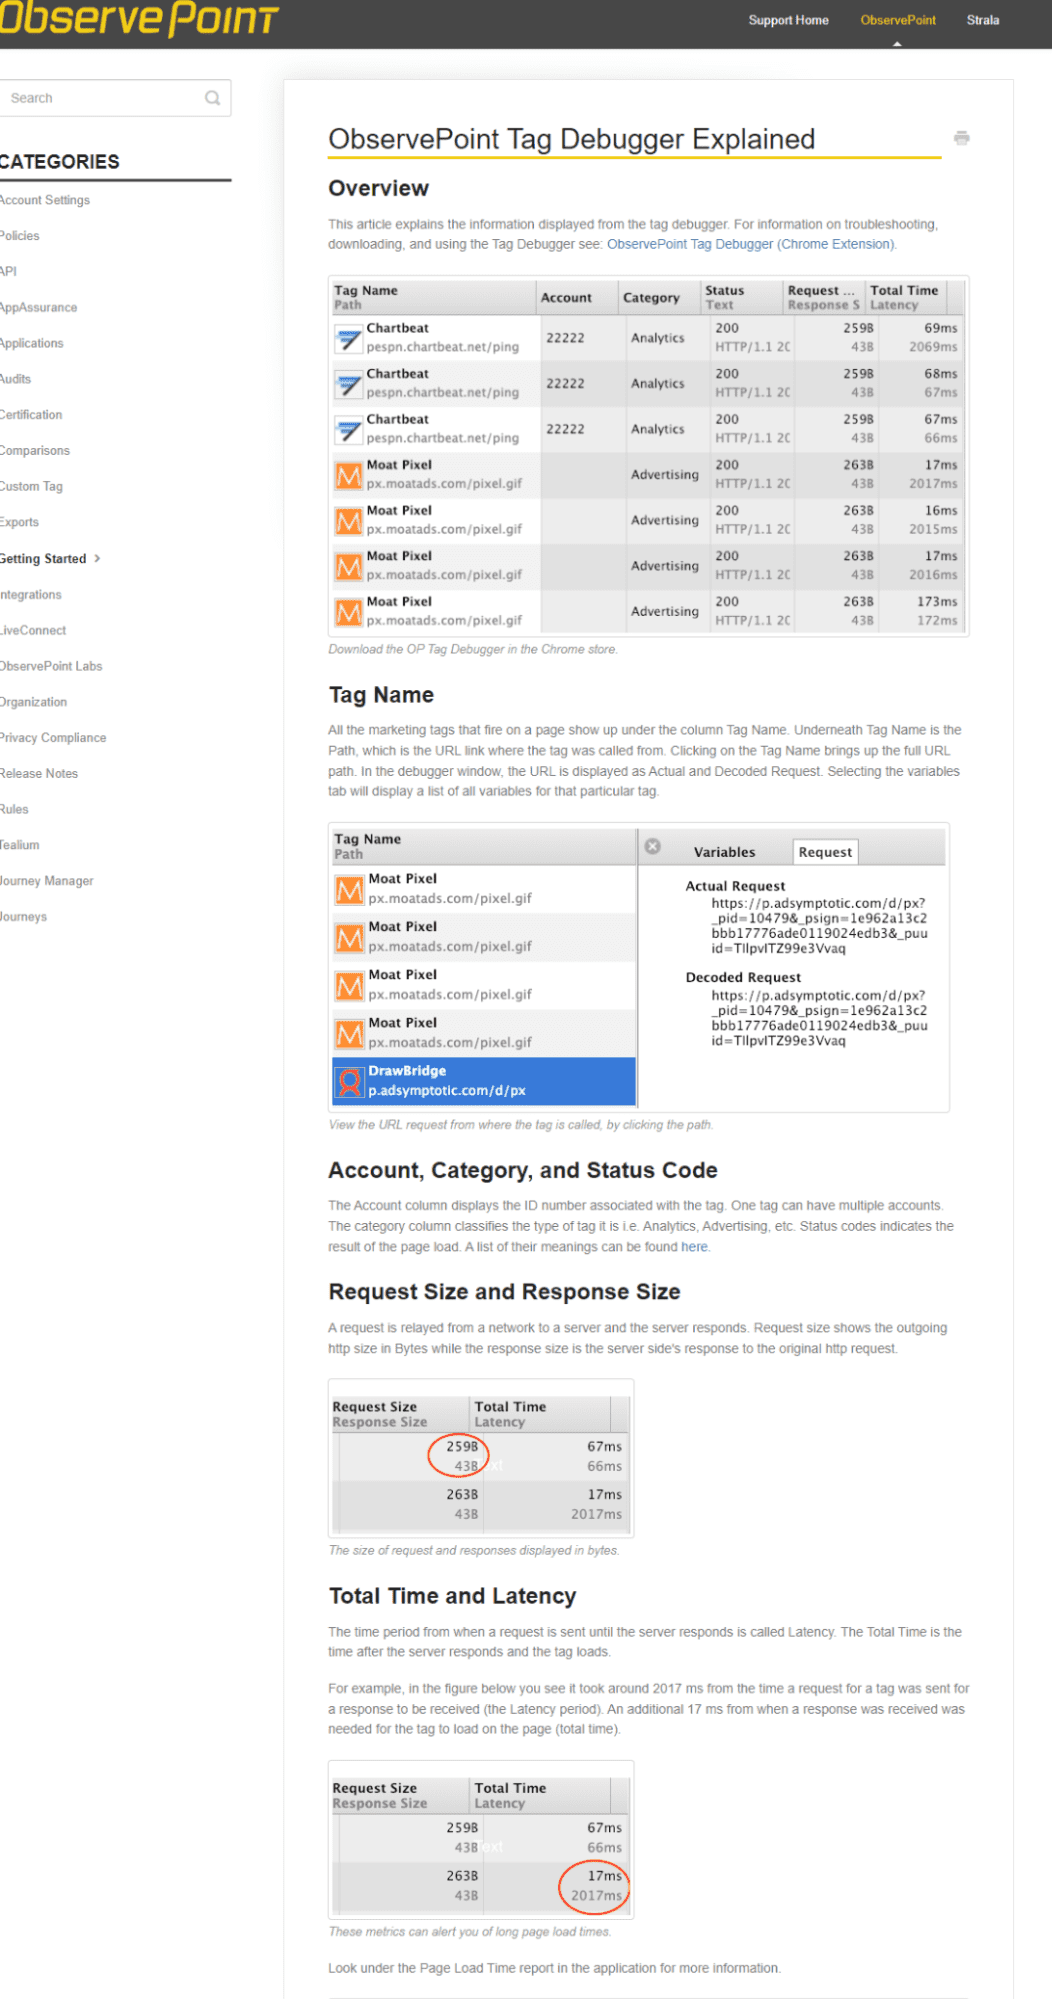
- Account : The value of this dimension varies from provider to provider. These are Adobe Analytics report suite, Google Analytics profile, Webtrends DCSID, etc. In ObservePoint, we call them accounts;
- Category : This is ObservePoint’s classification of the type of tag listed. Categories include Analytics, Advertising, Tag Management, Video, Voice of the Consumer, Split Testing, E-Commerce, and Lead Tracking. For a full list of all the tags they support, check out their tag database;
- Status : This is the network status code of the beacon request. Most should have status 200 (OK);
- Request/Response Size : The request size is the amount of data sent to the provider’s collection servers. The response is data sent back to your web browser by the provider;
- Total Time / Latency : Total time is measured from when the tag is initially requested until it is fully loaded.
Videos : Debug your Tags
Images : Debug your Tags
Company : Debug your Tags
Observe Point is an American digital governance company. It was founded in 2009 by John Pestana and Rob Seolas. Observe Point aims to help companies create better conditions for web marketing, by offering them a fully automated and flexible customer area.
Observe Point provides companies with the necessary tools for better marketing performance. It helps them to ensure the quality and protection of data and also allows them to optimize their customer area. Observe Point also enables companies to improve their technology governance as well as touchpoint management and privacy compliance.
Additionally, Observe Point offers a free Chrome extension called TagDebugger. Its role is to help you unlock the tags on your different pages. You will thus be able to read the tags that are placed on the pages you browse. With this extension, you have the possibility to export the different variables detected on the beacons to Excel in order to make a later analysis.
Contact : Debug your Tags
- Debug your Tags
- Check the Corporate Website
Social Media : Debug your Tags
- Youtube
Others Tools : Debug your Tags
Alexandre MAROTEL
Founder of the SEO agency Twaino, Alexandre Marotel is passionate about SEO and generating traffic on the internet. He is the author of numerous publications, and has a Youtube channel which aims to help entrepreneurs create their websites and be better referenced in Google.
Others SEO Tools
All SEO Tools
Sorry, no content found.