Short description : Heatmap Generator
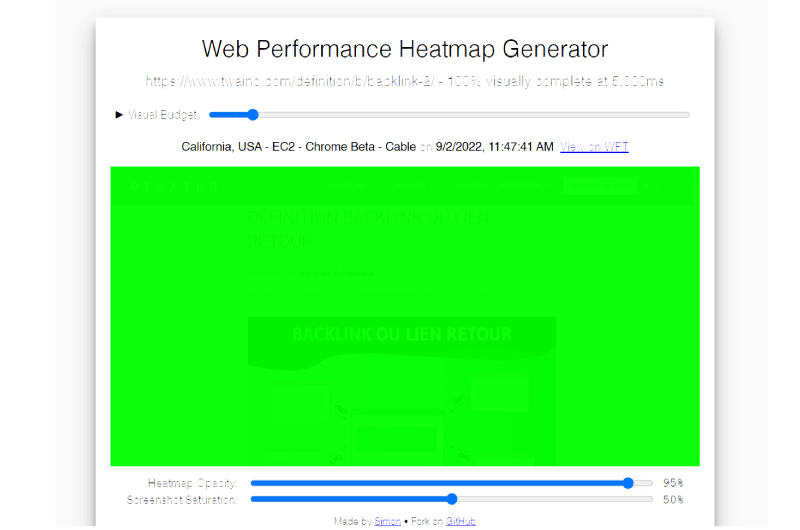
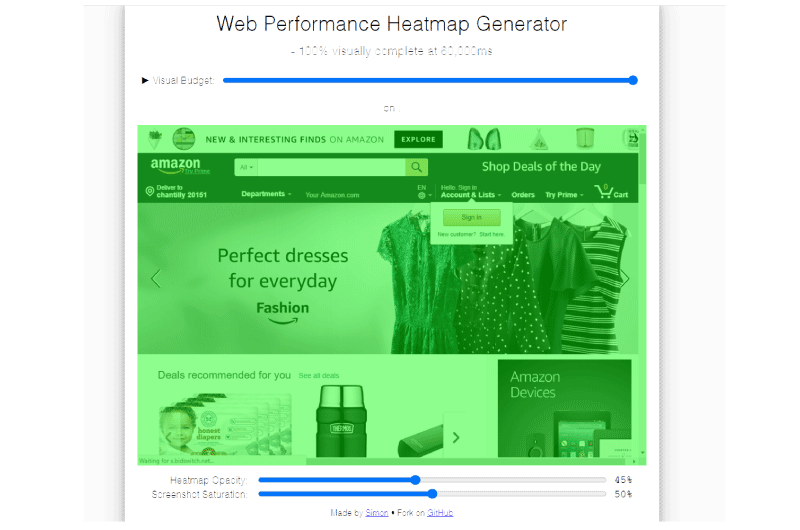
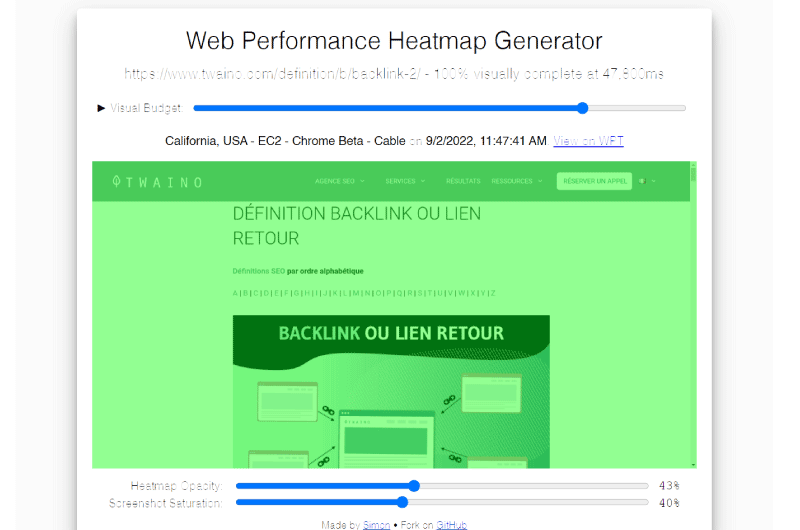
Web Performance Heatmap Generator allows you to visualize the time that important elements of a web page take before becoming visible.
Long Description : Heatmap Generator
Description Web Performance Heatmap Generator
Web performance is an essential factor in improving the user experience of a site as well as its ranking on search engine pages. This is why it is important to constantly monitor the performance of your website in order to readjust your strategy and maintain good results. Web Performance Heatmap Generator is an online heatmap generator that allows you to simulate connections to your pages in order to visualize how long important elements of your pages take to display completely.What is the Web Performance Heatmap Generator?
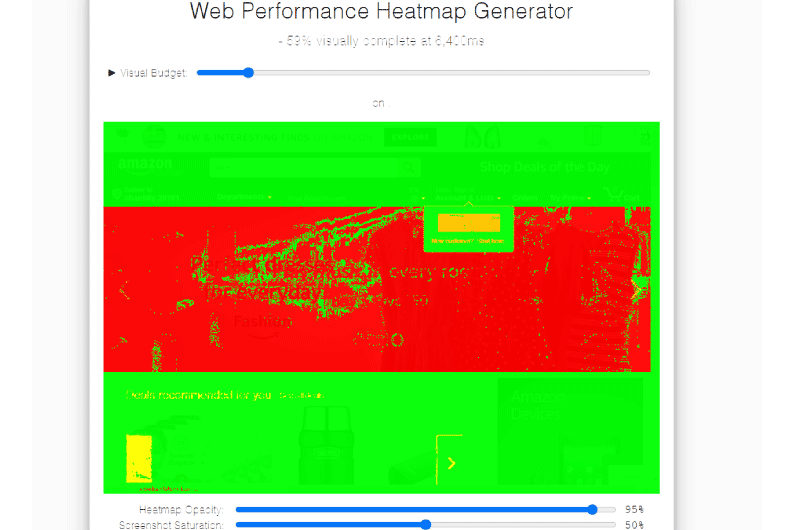
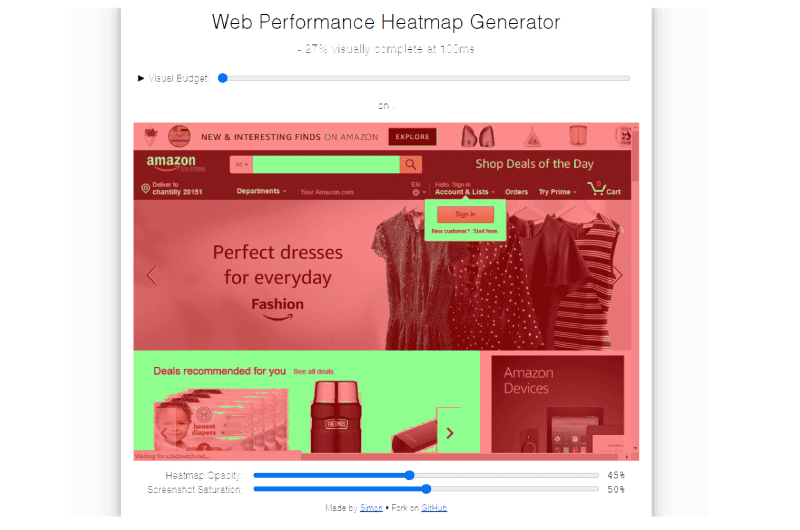
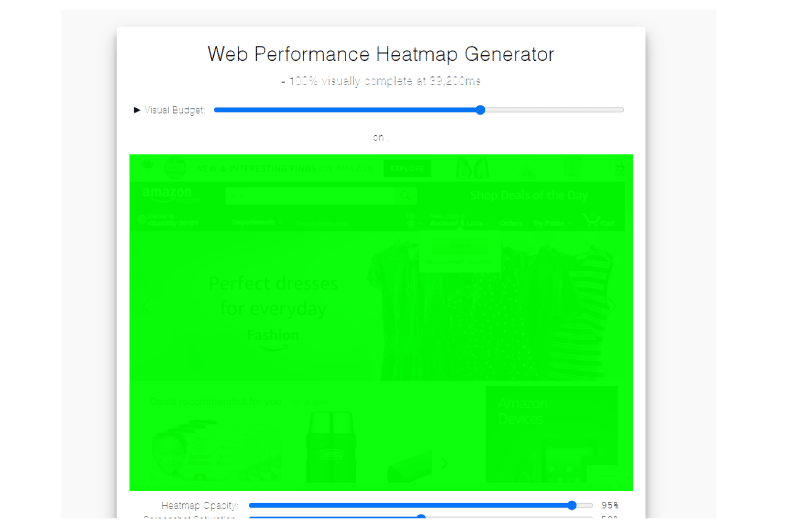
First of all, Web Performance Heatmap Generator is a heatmap generator, that is, it is a tool that uses color-coded representations to present data. This is a more assimilable way to consult and interpret data. Web Performance Heatmap Generator is a type of heatmap generator that lets you see data about your website’s performance, including load time. With the Web Performance Heatmap Generator, you can see on a heatmap which elements of your page display first and how long they take to display correctly. For this, the tool offers settings to simulate a connection to your site to test your performance from multiple locations and multiple browsers.Web Performance Heatmap Generator: How to use the tool?
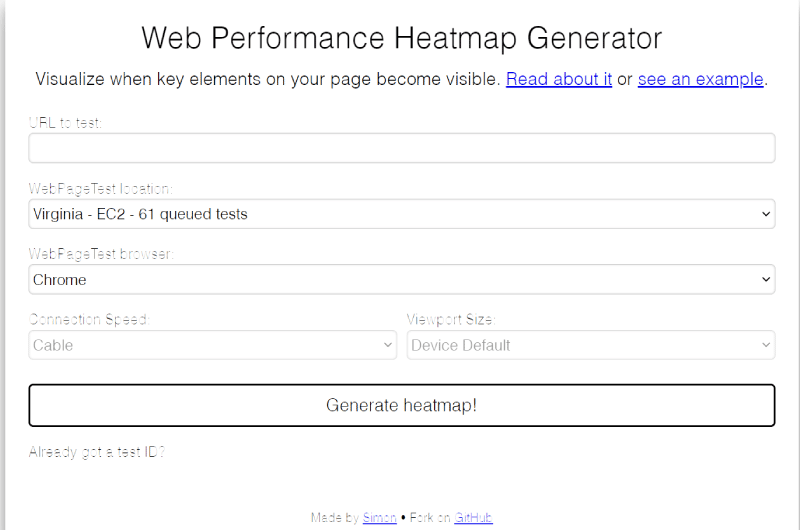
Using the web performance heatmap is very easy to master.- To get started, go to the Web Performance Heatmap Generator
- Then enter the URL of the web page to be tested
- Choose a geographical location from which the test will be carried out
- Choose a browser
- Then click on the “Generate Heatmap” button. After a few seconds of processing, the tool will display your test result.
Additional Resources
What is a Heatmap on a website?
A thermal map or Heatmap in English is a tool that allows you to visualize data in order to get an idea of the performance of a web page. The visualization of this data is in the form of a graphical map or diagram with a color palette to interpret the data and its values. Generally, heatmaps are represented by warm and cool colors in order to contrast the performance of the web page under test. Source: abtasty Most often, the warmest color represents the highest performance and the coolest color represents the lowest performance. When we take for example a heat map that allows to evaluate the intensity of visitor engagement, the marked sections marked with the brightest colors are the parts receiving the most engagement (parts where visitors click the most). And those marked by the coldest colors are the parts on which visitors click the least. As we can see, heatmaps represent a simple and at the same time effective way to analyze your data unlike numbers which can sometimes be confusing during interpretation.What are the different types of website heatmaps?
When it comes to website heatmaps, there are mainly 5 different types: Heatmap – used to visually represent the performance of web pages with regards to visitor engagement. Clickmap – used to represent the most clicked parts by Internet users on a web page. They are useful for tracking your images, links, in-call action buttons, etc. Scrollmap – used to represent visitors’ scrolling behavior so you know how far they scroll your pages and which sections they spend the most time on. Mouse Tracking Heatmap – used to identify the parts over which your visitors hover the most. Eye-Tracking Heatmap – this type of heatmap can be confused with Mouse Tracking Heatmap. It takes into account the time visitors stare at an image and the number of times the image is viewed.Which heat map generator can be used to analyze the loading time of a web page?
When we talk about the performance of a web page, the loading time is a very important factor. Web Performance Heatmap Generator is an online heatmap generator that allows you to plot the performance of a web page and specifically how long important elements of the page take to fully render. All you have to do is type in the URL of the page you want to test and choose a geographic location and browser to simulate a visit. The tool will then show you the performance of the page at that specific location. This is very useful for testing your performance around the world.Videos : Heatmap Generator
Images : Heatmap Generator
Company : Heatmap Generator
Simon Hearn is a digital company that helps users create and automate responsive images. It was created by Simon Hearn, a web performance advocate and user experience writer.
Simon Hearn developed the Performance Heatmap and Generator Request Map Generator web tools. Thanks to this company, it is possible to generate valid image markup, collect, create and visualize beautiful image data.
It has other features like:
- Web performance monitoring;
- The proposal of the best responsive landing page videos;
- Developing and loading web fonts quickly;
- Optimization of important elements on single page applications (SPA);
- The suggestion of optimistic interface models;
- Etc.
Contact : Heatmap Generator
- Heatmap Generator
- Check the Corporate Website
Social Media : Heatmap Generator
- Youtube
Others Tools : Heatmap Generator
 Alexandre MAROTEL
Founder of the SEO agency Twaino, Alexandre Marotel is passionate about SEO and generating traffic on the internet. He is the author of numerous publications, and has a Youtube channel which aims to help entrepreneurs create their websites and be better referenced in Google.
Others SEO Tools
All SEO Tools
Sorry, no content found.

